- GOLD analysis daily time frame chart
Notícias do Mercado
15 janeiro 2018
GOLD analysis daily time frame chart
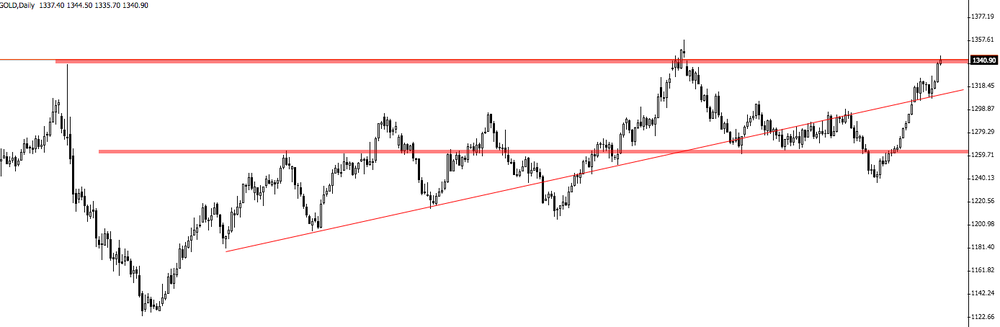
Gold has been following a strong bullish movement since it hit the 1259.71$ zone.
At this moment on daily time frame chart we can see that the price is now close to the zone 1340.00$.
However, this can be interesting to trade for long or short entries. It will depend how the price reacts there.
O foco de mercado
Abrir Conta Demo e Página Pessoal