- AUD/JPY Daily time frame chart
Notícias do Mercado
17 janeiro 2018
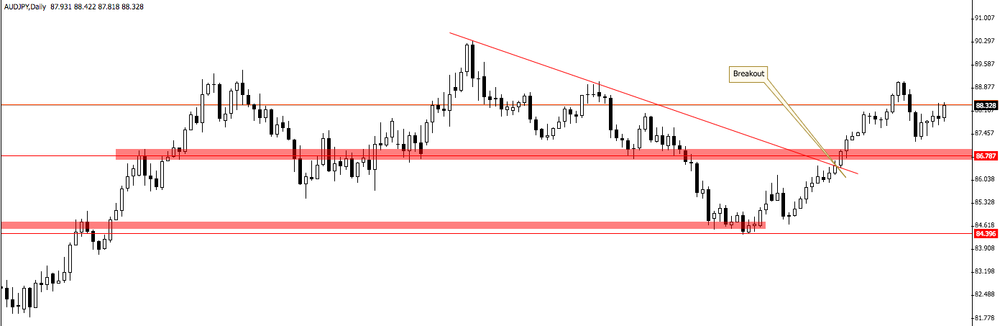
AUD/JPY Daily time frame chart
AUD/JPY on daily time frame chart we can see that the price has broken a downside trend line and a resistance level which the price has already shown some difficulty in breakthrough that zone.
After the breakout of the trend line and the resistance level the price starts a new bullish movement.
Therefore, our bias on this pair remains - long
O foco de mercado
Abrir Conta Demo e Página Pessoal