- EUR/GBP Analysis
Notícias do Mercado
28 fevereiro 2018
EUR/GBP Analysis
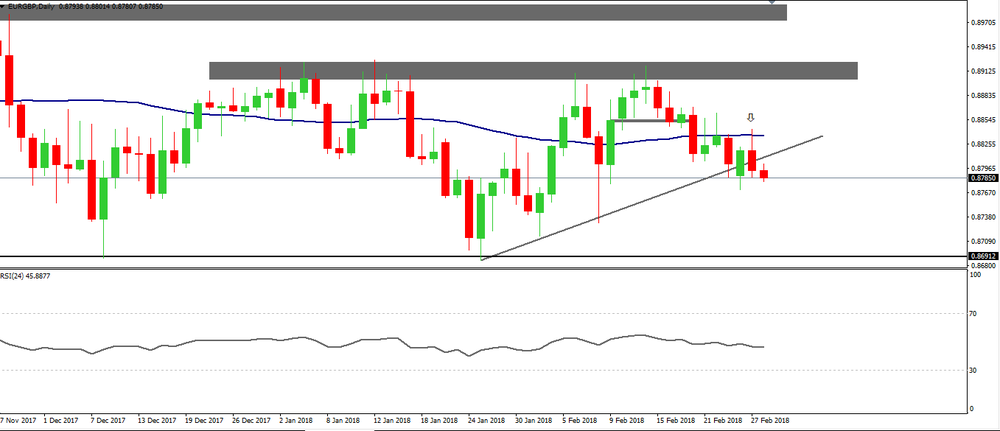
On daily time frame chart we can see that the price has broken recently the upside trend line and it tests below the simple moving average (SMA:50).
Therefore, if the price stays below the trend line then we can expect a new bearish movement until the previous lows.
O foco de mercado
Abrir Conta Demo e Página Pessoal