- Crude oil analysis
Notícias do Mercado
8 março 2018
Crude oil analysis
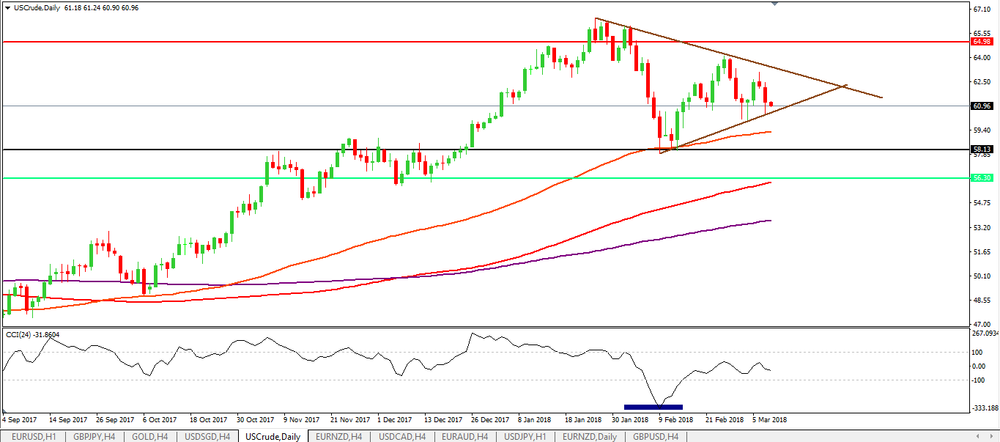
Crude oil on a daily chart, we can see that it is moving close to the upside trend of the chart pattern (Triangle).
If we watch the price rejecting new downside movements. in the smaller time frames, we might consider long entries in this commodity.
Therefore, our first target will be near to the downside trend and the second target could be slightly above it - speculating that the price will break above the chart pattern.
O foco de mercado
Abrir Conta Demo e Página Pessoal