- GBP/USD Price Analysis: Bears challenge 200-hour SMA/ascending trend-line confluence support
Notícias do Mercado
GBP/USD Price Analysis: Bears challenge 200-hour SMA/ascending trend-line confluence support
- GBP/USD witnessed some selling on Tuesday amid the emergence of some USD dip-buying.
- The set-up favours bearish traders and supports prospects for a further depreciating move.
- A sustained move beyond mid-1.3600s is needed to negate the near-term bearish outlook.
The GBP/USD pair witnessed some selling during the early European session and dropped to four-day lows, around the 1.3570-65 region in the last hour.
Against the backdrop of expectations for an early policy tightening by the Fed, the risk-off impulse in the markets assisted the safe-haven US dollar to reverse an early dip. This, in turn, was seen as a key factor that exerted some pressure on the GBP/USD pair.
On the other hand, the British pound was pressured by the UK-EU stand-off over the Northern Ireland protocol of the Brexit agreement. This overshadowed mostly upbeat UK monthly employment figures for September and acted as a headwind for the GBP/USD pair.
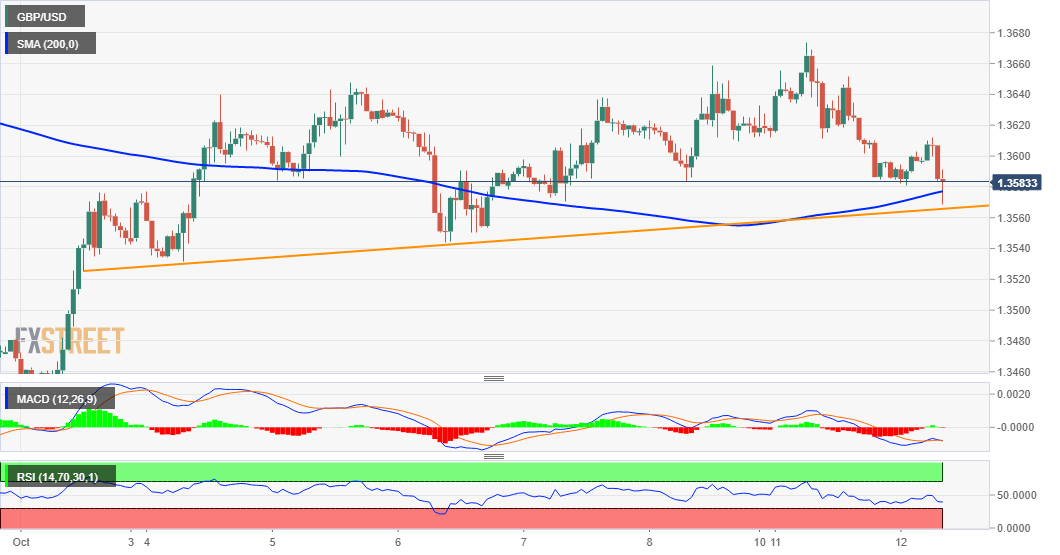
From a technical perspective, the was seen flirting with confluence support comprising of 200-hour SMA and over one-week-old ascending trend-line. A convincing break below will prompt aggressive technical selling and pave the way for additional losses.
Meanwhile, oscillators on the daily chart maintained their bearish bias and have been gaining negative traction on hourly charts. The set-up seems tilted firmly in favour of bearish traders and supports prospects for an eventual breakthrough the confluence support.
The subsequent downfall has the potential to drag the GBP/USD pair towards intermediate support near the 1.3530-25 region en-route the key 1.3500 psychological mark. Some follow-through selling could expose September monthly swing lows, around the 1.3415-10 area.
On the flip side, the 1.3610-15 region now seems to have emerged as immediate strong resistance. This is followed by resistance near mid-1.3600s and the overnight swing highs, around the 1.3670-75 region, or near two-week tops touched in the previous day.
A sustained strength beyond will negate any near-term bearish bias and push the GBP/USD pair further beyond the 1.3700 mark, towards testing the next relevant hurdle near the 1.3720-25 region. This is followed by a strong horizontal barrier near the 1.3750-55 zone.
GBP/USD 1-hour chart
Technical levels to watch