- Gold Price Forecast: XAU/USD needs acceptance above key $1798 level for further upside – Confluence Detector
Notícias do Mercado
Gold Price Forecast: XAU/USD needs acceptance above key $1798 level for further upside – Confluence Detector
- Gold price pauses a three-day uptrend amid rebounding US Treasury yields.
- The dollar bounces with yields amid risk-on mood, US Retail Sales in focus.
- Elliott Wave view: Gold should rally further short term.
Gold price is reversing from monthly highs just ahead of the $1800 mark, as the US dollar rebounds in tandem with Treasury yields amid the upbeat market mood. Robust US corporate earnings douse fears over growing inflation risks, boosting the investors’ sentiment at the expense of the safe-haven gold. Meanwhile, failure to find a hold above the $1800 mark pushes gold price lower, as traders await the US consumer-centric data for a decisive move in the bright metal.
Read: Gold Price Forecast: XAU/USD bulls testing bears’ commitment at crucial daily resistance, US consumer data eyed
Gold Price: Key levels to watch
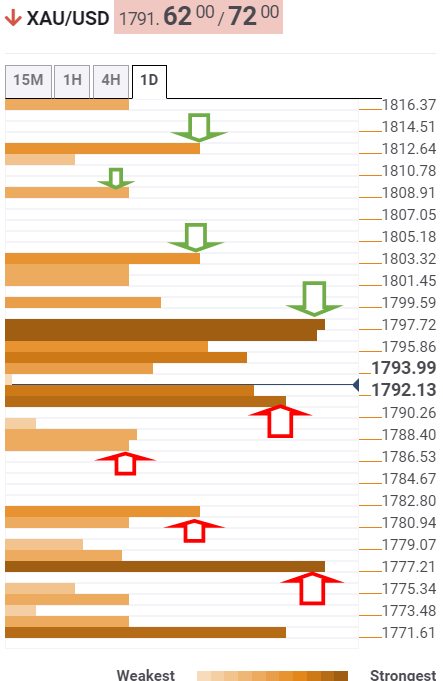
According to the Technical Confluences Detector, gold is consolidating the recent upsurge, lacking a follow-through upside bias, as a dense cluster of significant resistance levels around $1798 remains a tough nut to crack for the buyers.
The Fibonacci 23.6% one-day, pivot point one-week R2, SMA200 and SMA100 one-day coincide around that price zone.
Acceptance above the latter will expose the $1803 barrier, which is the confluence of the Fibonacci 161.8% one-week and pivot point one-day R1.
The next bullish target is seen at $1809, the pivot point one-day R2, above which $1812 will be on the buyers’ radars.
Alternatively, gold price sees an immediate cushion at $1790, where the Fibonacci 61.8% one-month aligns.
Additional downside pressure will prompt gold sellers to test $1787, the intersection of the previous day’s low and pivot point one-day S1.
The next significant support awaits at the previous week’s high of $1781.
Further south, the convergence of the SMA50 one-day and pivot point one-week R1 at $1778 will be the level to beat for the bears
Here is how it looks on the tool

About Technical Confluences Detector
The TCD (Technical Confluences Detector) is a tool to locate and point out those price levels where there is a congestion of indicators, moving averages, Fibonacci levels, Pivot Points, etc. If you are a short-term trader, you will find entry points for counter-trend strategies and hunt a few points at a time. If you are a medium-to-long-term trader, this tool will allow you to know in advance the price levels where a medium-to-long-term trend may stop and rest, where to unwind positions, or where to increase your position size.