- Gold Price Analysis: XAU/USD path to reattacking $1,800 has two roadblocks – Confluence Detector
Notícias do Mercado
Gold Price Analysis: XAU/USD path to reattacking $1,800 has two roadblocks – Confluence Detector
- XAU/USD has been on the back foot as US yields rise.
- The Confluence Detector is showing is that gold faces two hurdles ahead of $1,800
- Gold is not a dream risk-off hedge, nor is Bitcoin [Video]
Gold and Bitcoin – many tend to compare them, and this week, they have both made false breaks at round levels. The granddaddy of cryptos at $60,000, and the precious metal at $1,800. In gold's case, the drop can be attributed to the rise of US Treasury yields. The sell-off in bonds has put pressure on XAU/USD, especially after US Retail Sales shattered expectations.
How is gold technically positioned? Bears seem to have the upper hand.
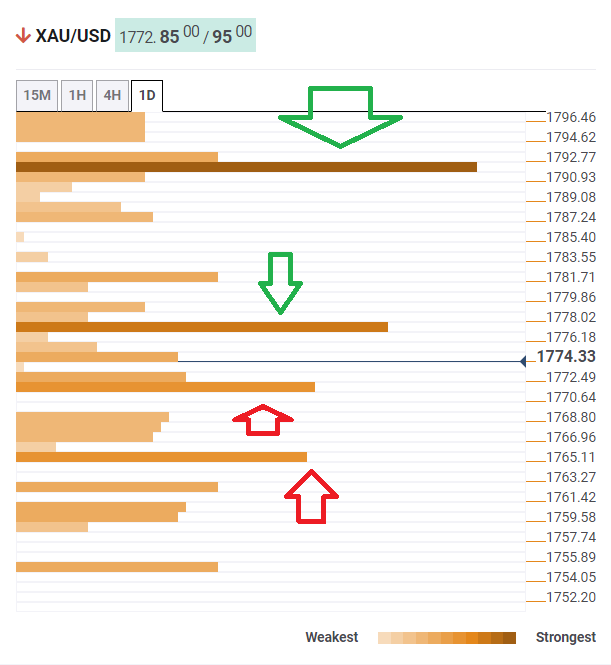
The Technical Confluences Detector is showing that XAU/USD faces initial resistance at around $1,777, which is the convergence of the Bollinger Band 15min-Middle, 50-day Simple Moving Average and the Pivot Point one-week Resistance 1.
The bigger hurdle awaits gold at $1,791, which is where the Fibonacci 61.8% one-month, the SMA 50-1h and the BB one-day Upper all meet.
Some support awaits at $1,770, which is where the 5-day SMA and the BB 1h-Lower hit the price.
The next cushion is at $1,765, which is the confluence of the Fibonacci 38.2% one-month and the BB 15min-Lower.
XAU/USD resistance and support levels
Confluence Detector
The Confluence Detector finds exciting opportunities using Technical Confluences. The TC is a tool to locate and point out those price levels where there is a congestion of indicators, moving averages, Fibonacci levels, Pivot Points, etc. Knowing where these congestion points are located is very useful for the trader, and can be used as a basis for different strategies.
Learn more about Technical Confluence