- AUD/NZD Price Analysis: Traders, don't get caught out!
Notícias do Mercado
AUD/NZD Price Analysis: Traders, don't get caught out!
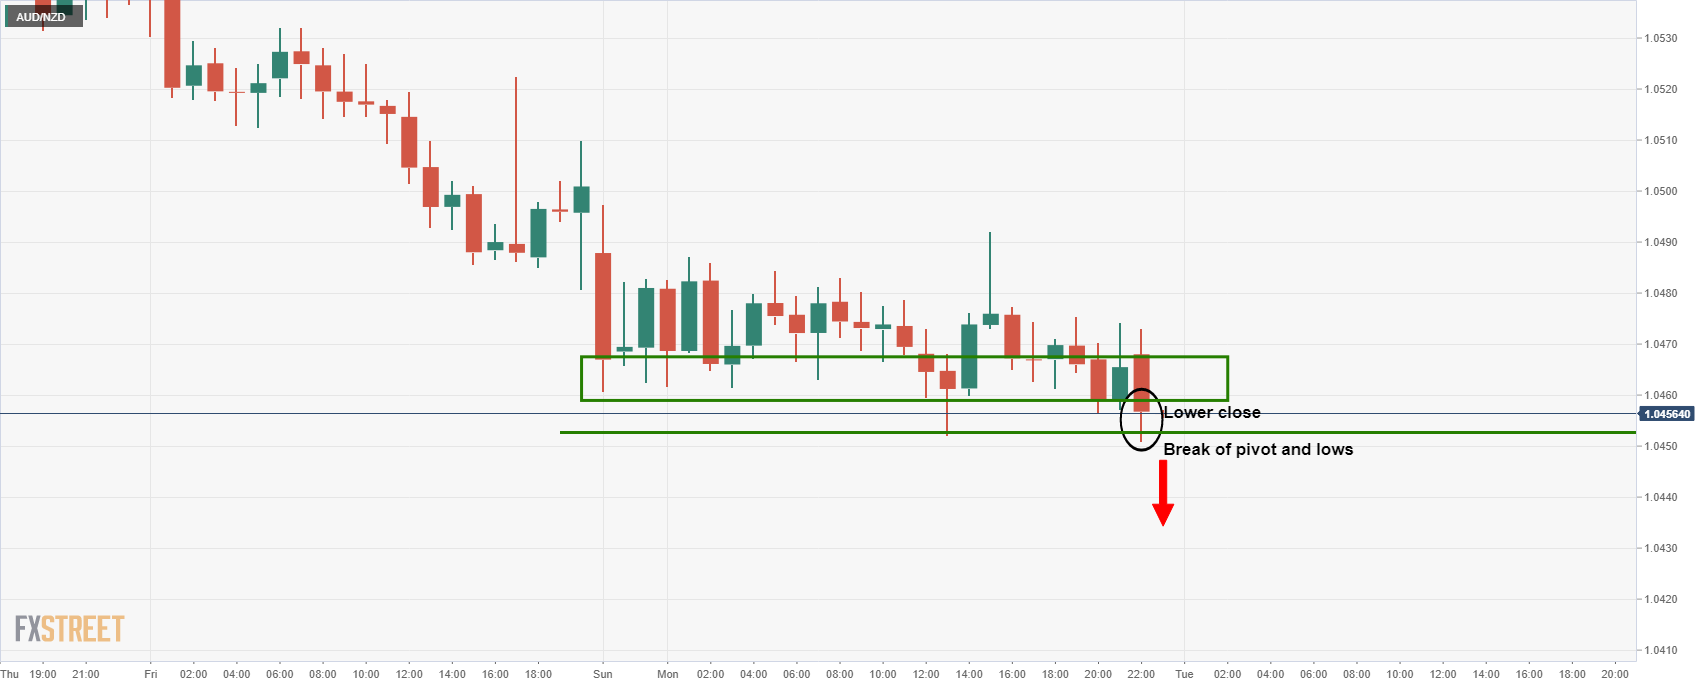
- AUD/NZD is making a fresh low in the Asian session, expended the bearish trend.
- Bears should be aware and take precautions against a significant bullish correction, however.
AUD/NZD is on the verge of a downside breakout below the recent phase of accumitlaiton. However, there is a caveat to such a forecast —The daily M-formation.
The following is a top-down analysis between the daily and hourly chart and goes as a reminder that when trading lower time frames, it is always prudent to zoom out to the higher time frames for the bigger picture.
AUD/NZD hourly chart

Despite the fresh low, lower close and bearish tendency of the trend, the price could be faking out here according to the daily chart's analysis below.
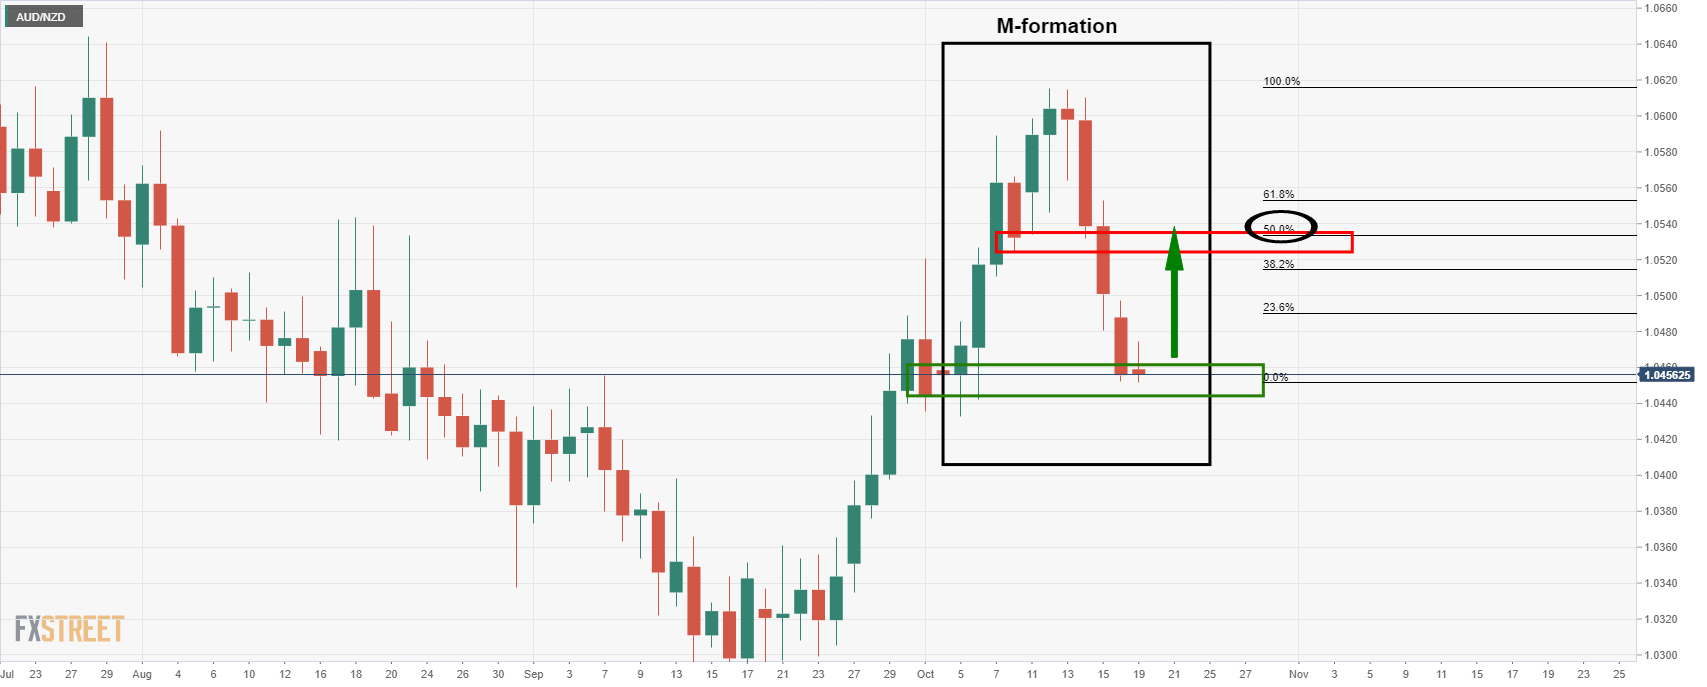
AUD/NZD daily chart

The M-formation is a bullish reversion pattern that would be expected to draw in the price for a test of the formation's neckline. In this case, that level is the 8 Oct low at 1.0524.
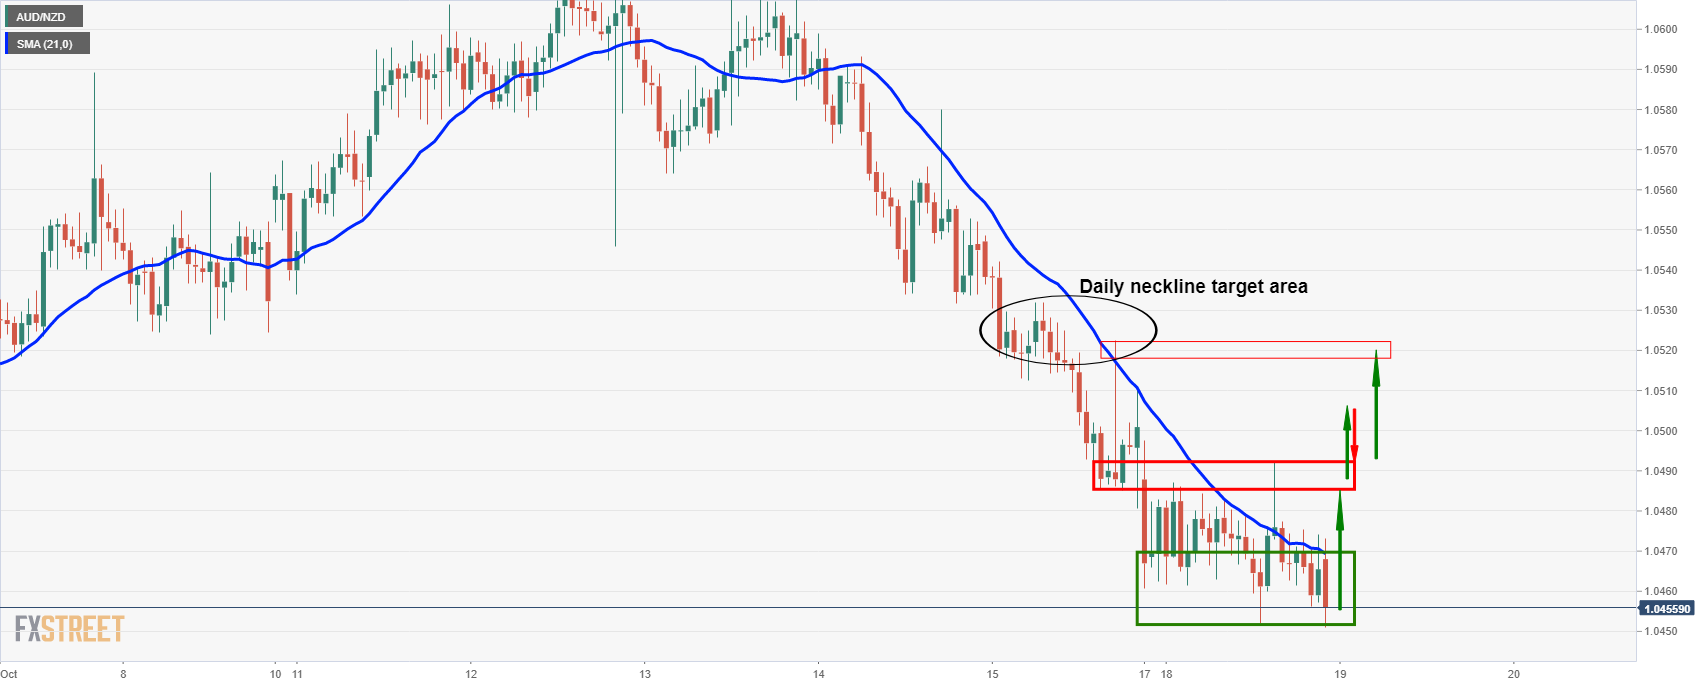
AUD/NZD hourly chart

So, instead of looking for an immediate downside extension, the bulls could be accumulating here and on a break of near term resistance, the bulls can target the M-formation's neckline near 1.0520.
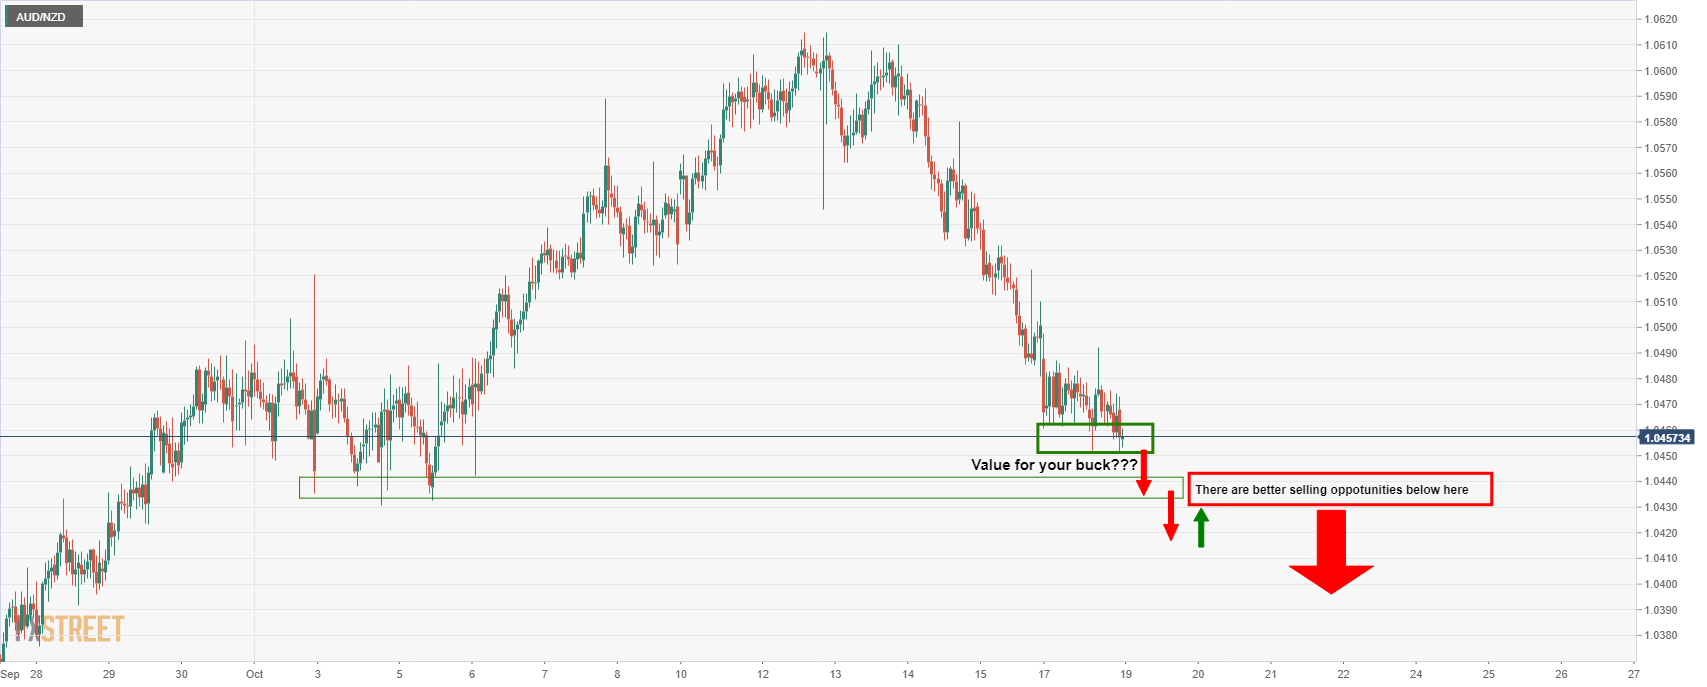
With all this being said, there is still every chance that the price will melt to fresh lows from here. But how far can it go before meeting an old demand area and expected support?
