- NZD/USD Price Analysis: Daily support holding up following weekly breakout
Notícias do Mercado
25 outubro 2021
NZD/USD Price Analysis: Daily support holding up following weekly breakout
- NZD/USD is trying to break higher on the daily and weekly charts.
- NZD/USD holds in the daily support area and consolidates.
The price is meeting an area of strong support. However, the corrective candle was very strong so the momentum to the upside keeps the price offered as per the below daily chart:
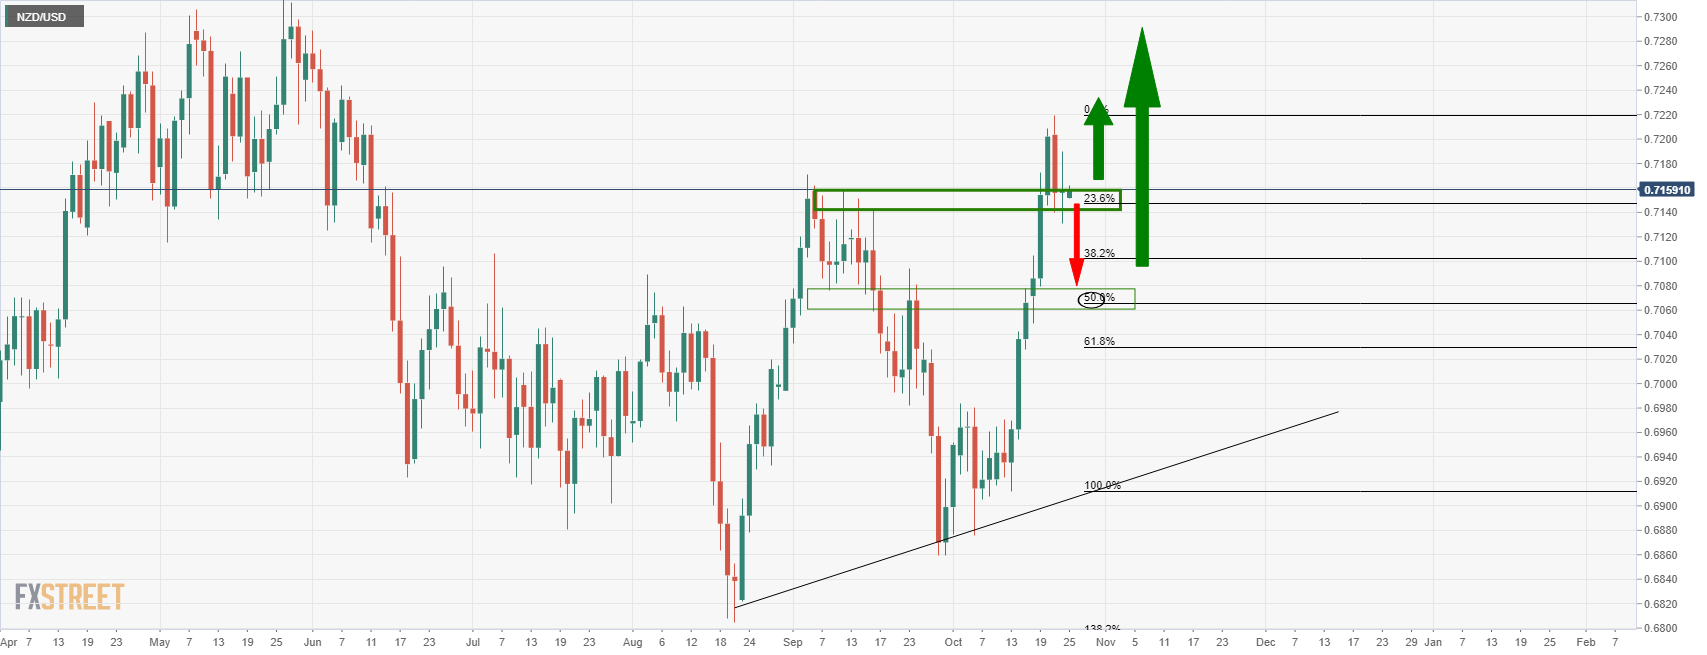
If the support breaks, the price could easily move through the volumes to reach at least 38.2% Fibonacci retracement of the bullish impulse. This will be the last defence for the 50% mean reversion target.
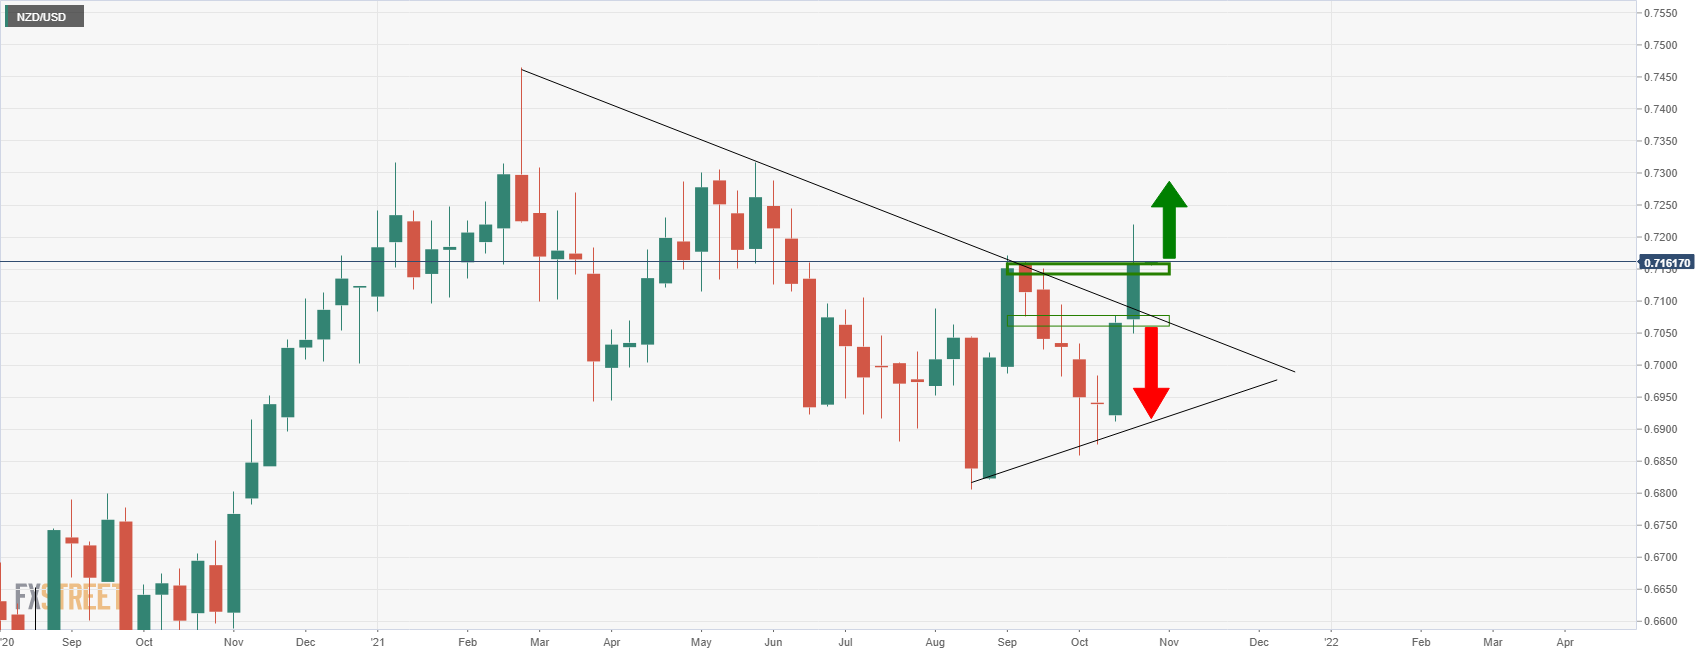
The weekly chart below shows that the price could move back into the triangle and head towards the dynamic trendline support:
O foco de mercado
Abrir Conta Demo e Página Pessoal