- Gold Price Forecast: XAU/USD printed a daily close above $1,800, bull’s eye $1,834
Notícias do Mercado
Gold Price Forecast: XAU/USD printed a daily close above $1,800, bull’s eye $1,834
- On Monday, gold advanced $17 during the day, despite risk-on market sentiment.
- Gold has rallied for five consecutive days, climbing almost $50 until the current market price.
- XAU/USD: The daily chart is tilted to the upside, but strong resistance at $1,834 lies ahead.
- US 10-year T-bond yield: A break below 1.55% could push gold prices toward $1,834 and beyond.
Gold (XAU/USD) is barely flat as the New York session winds down and the Asian session begins, is trading at $1,807.68 during the day at the time of writing. On Monday, the non-yielding metal rose almost 1%, from $1,792 to $1,810, amid lower US T-bond yields, with the 10-year yield dropping from 1.678% to 1.633%.
Risk-on market sentiment prevailed during the Monday New York session as portrayed by US stock indices rising between 0.18% and 1.04%, gaining follow-through in the Asian session. Equity futures in Asia climb between 0.12% and 0.31%, except for the FTSE China A 50, down some 0.30%.
Gold reached five days in a row in advance; though the gains have been minimal, the price steadily climbed towards $1,800. The Federal Reserve entered the blackout period until the November 2-3 meeting, when investors expect the announcement of the bond tapering program. Those expectations kept gold from a steep upward move, as the market cautiously weighs inflationary pressures and the possibility of higher rates in the US.
XAU/USD Price Forecast: Technical outlook
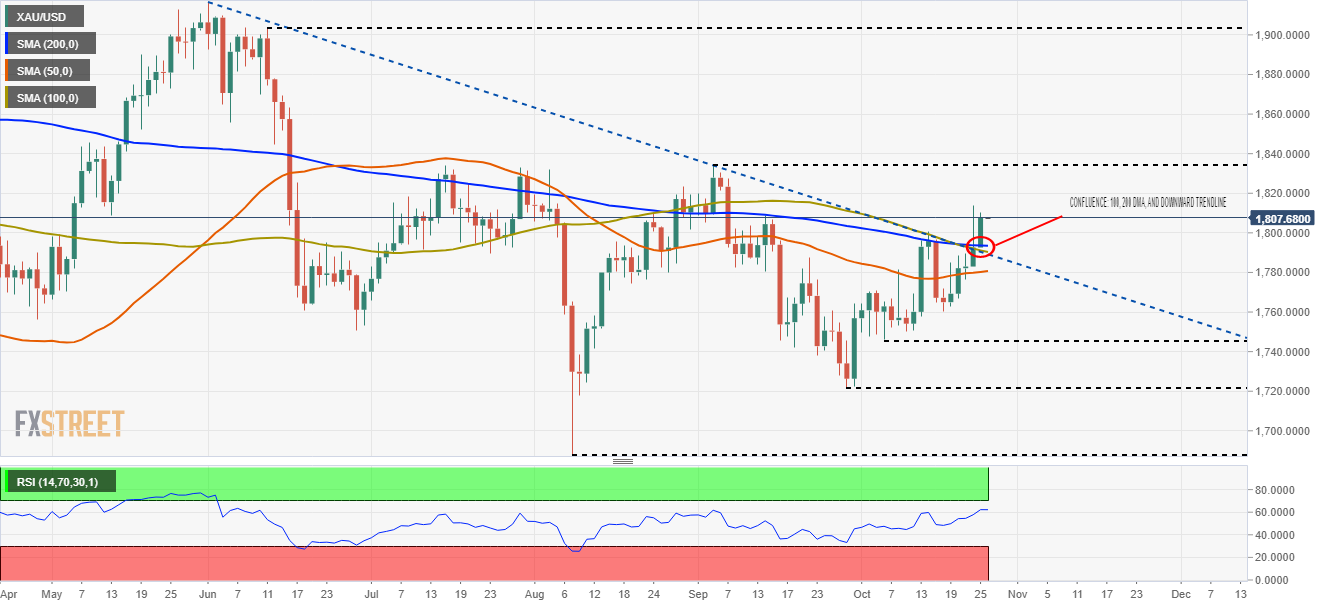
Daily chart
On Monday, gold (XAU/USD) broke a five-month-old downward slope trendline along with the confluence of the 100 and the 200-day moving averages (DMA’s), printing a daily close above $1,800 for the first time since September 8. The abovementioned could well be a strong signal that the yellow-metal might be headed toward higher prices, but the September 3 high at $1,834 would be the first resistance level to surpass on its way towards $1,900. In case of that outcome, there would be nothing on the $1,900 path.
On the flip side, a reversal towards $1,780 could exert additional downward pressure to XAU/USD, leaving $1,746 as the first support area. A clear break of the latter could expose essential support areas—the September 29 low at $1,721, followed by the August 9 low at $1,687.
The Relative Strength Index (RSI) at 62 above the 50-midline supports the upside bias, but the slope is flattish so that gold might be headed for consolidation.
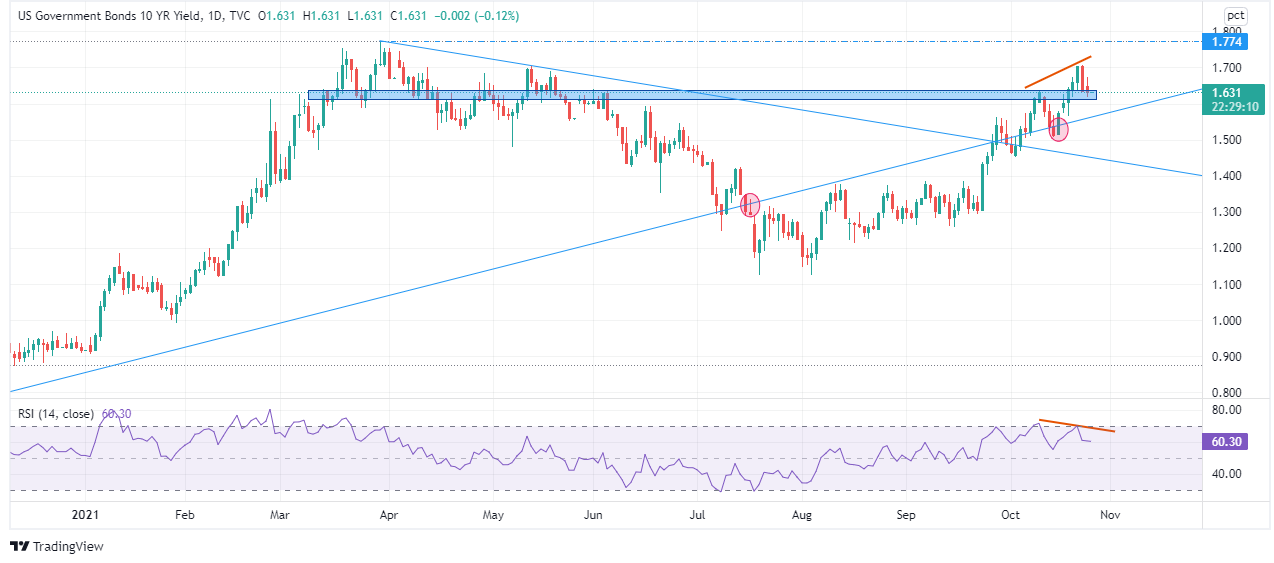
US Government Bond 10-year Treasury yield
The daily chart of the US 10-year Treasury yield depicts a negative divergence with the yield pushing higher, while the Relative Strength Index tops is printing lower highs.
The abovementioned suggest that the US 10-year bond coupon might be headed lower, but at press time, it is testing an area supported for about four months. Also, around the 1.55% area lies an upward trendline broken to the downside in July, but reclaimed its support status on October 15, when the 10-year reached a high of 1.579%. Hence, confirmation of the negative divergence could open the way for another leg-down in yields, thus propelling gold prices higher.