- USD/JPY Price Analysis: 100-HMA, descending triangle keep buyers hopeful
Notícias do Mercado
USD/JPY Price Analysis: 100-HMA, descending triangle keep buyers hopeful
- USD/JPY keeps rebound from 12-day low, picks up bids of late.
- Firmer RSI conditions, bullish chart pattern challenge seller’s entry.
- The 114.15 mark acts as a short-term key hurdle to the north.
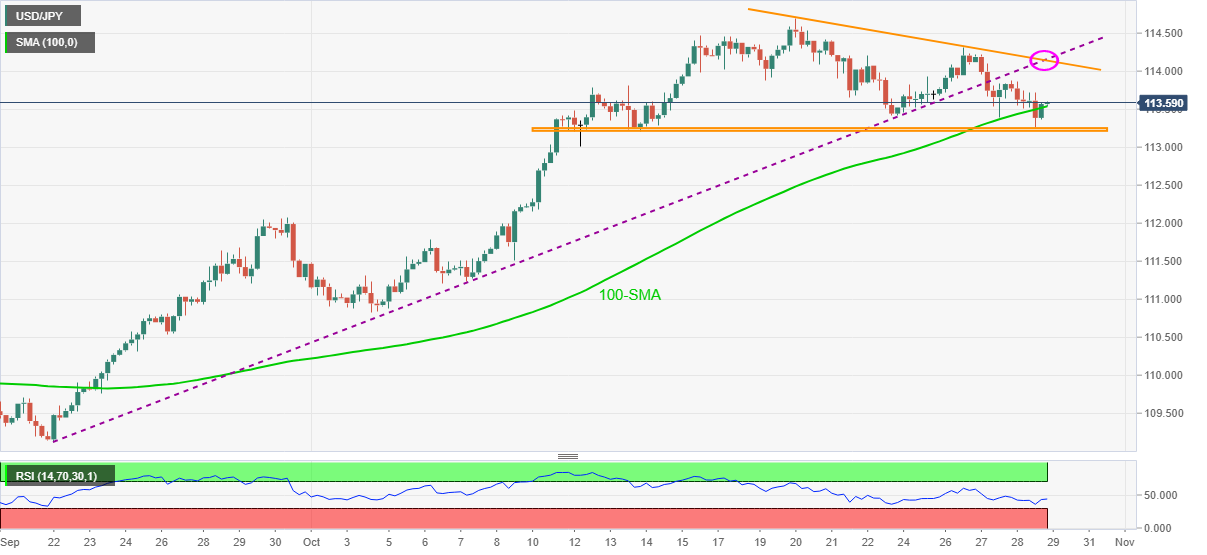
USD/JPY pokes intraday high around 113.60 as European traders brush their screens for Friday’s tasks. The yen pair dropped to the lowest in two weeks the previous day before bouncing off 100-SMA.
The corrective pullback portrays a short-term descending triangle bullish chart pattern amid a firmer RSI line. However, the previous support line from September 22 becomes the key challenge for bull’s entry.
Hence, the USD/JPY pair’s upside break to the 114.00 threshold becomes imminent but the further upside will be challenged by the stated triangle’s upper line and the support-turned-resistance line around 114.15.
On the contrary, the 100-SMA level of 113.50 and the triangle’s support line near 113.20 questions the short-term declines of the pair.
Following that, the September-end top near 112.00 will gain the USD/JPY seller’s attention, a break of which will highlight the monthly low near 110.80.
USD/JPY: Four-hour chart
Trend: Further upside expected