- WTI Price Analysis: Price meets M-formaiton neckline resistance
Notícias do Mercado
WTI Price Analysis: Price meets M-formaiton neckline resistance
- Oil prices are being pressured at a key level of daily resistance.
- Bears can look to the 79 figure as a potential downside target.
WTI is stalling on the bullish cycle that has been in place since the end of summer 2021. Super high prices could well be struck by the law of gravity in the coming days and weeks ahead and the following analysis illustrates the bearish bias building on a daily basis.
WTI daily chart
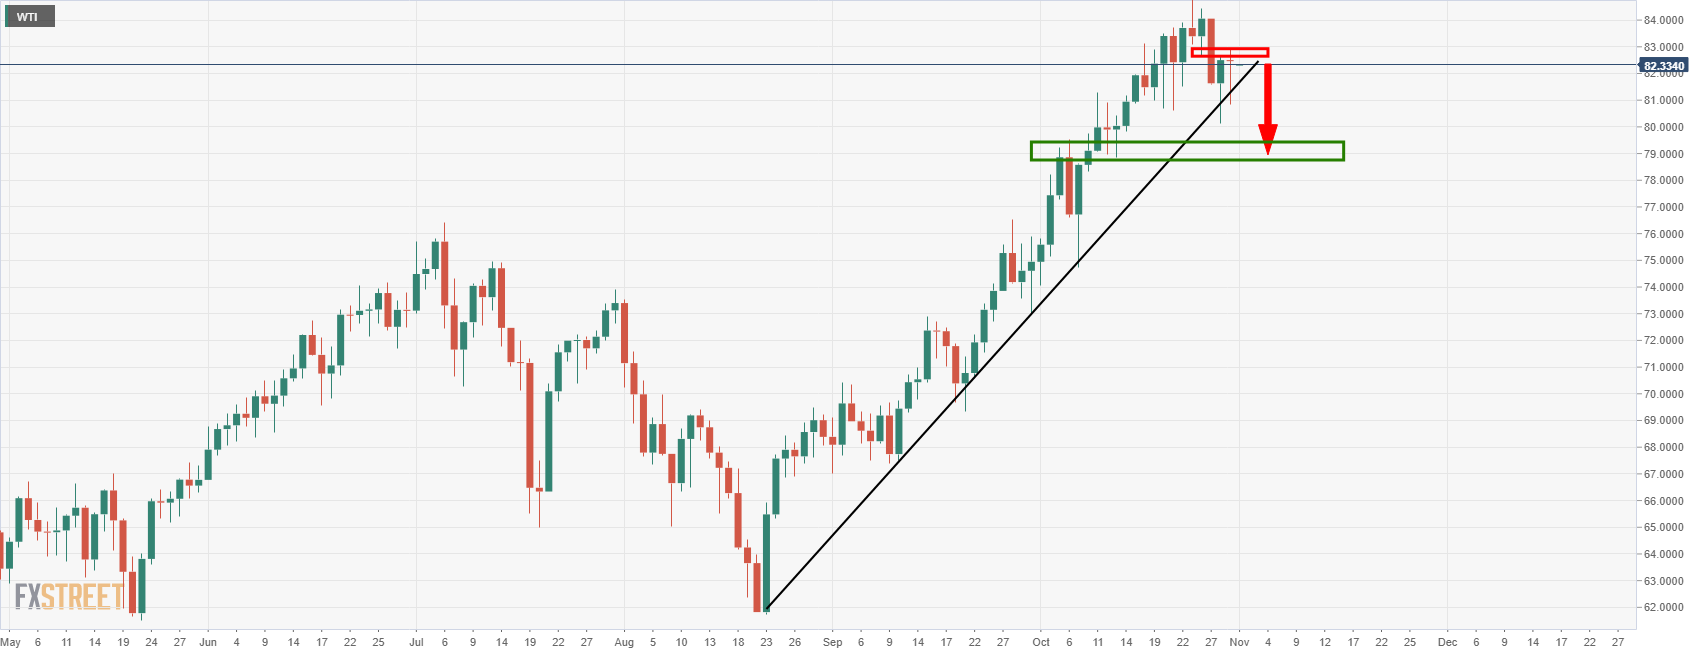
The above analysis illustrates that the price is forming a top with the risk of a break of the dynamic support line. Zooming in, we can also see that the price is meeting the neckline of the M-formation and horizontal resistance as follows:
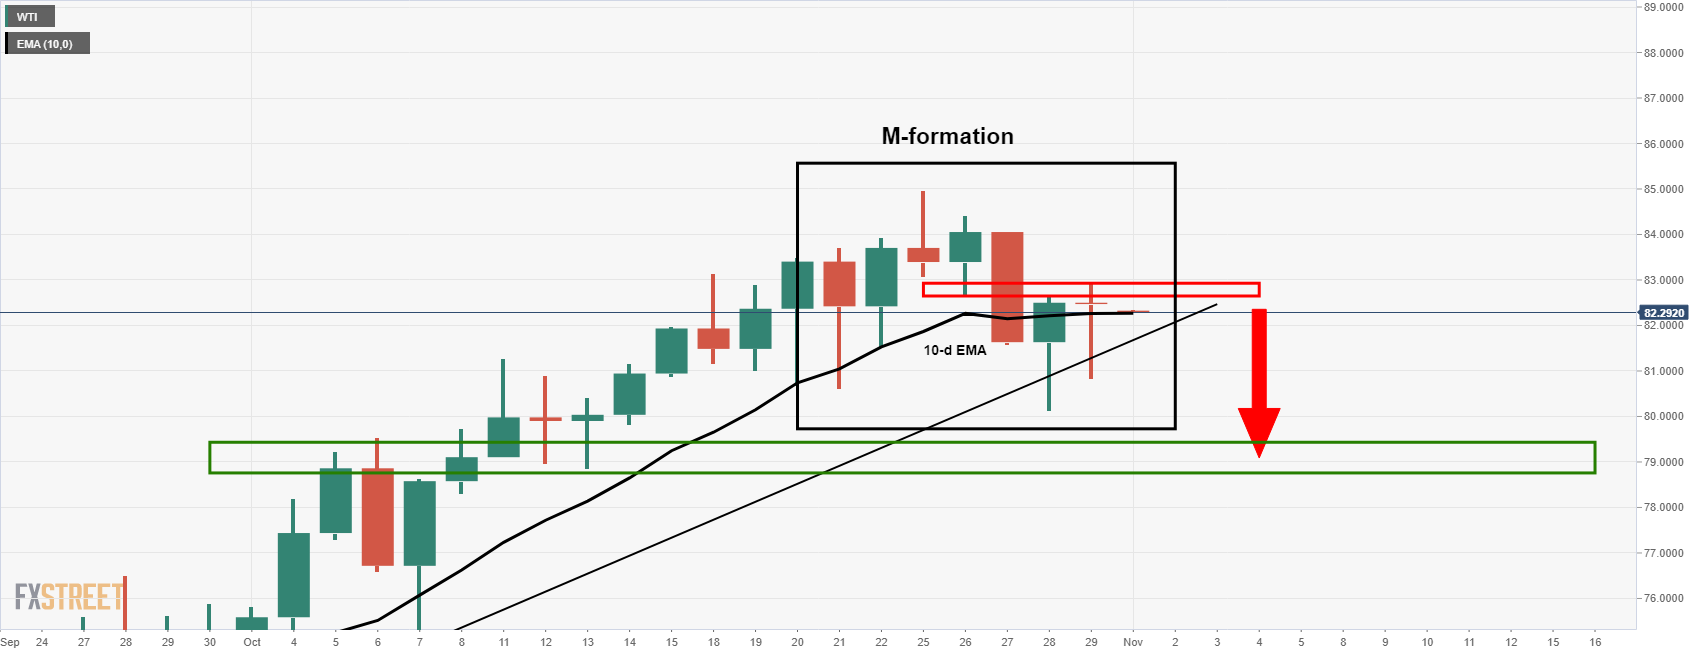
The resistance comes in at 82.70 with room to go to 83.40 before the air becomes thin and potentially gives way to a bullish continuation. The M-formation is better visualized on a line chart as follows:
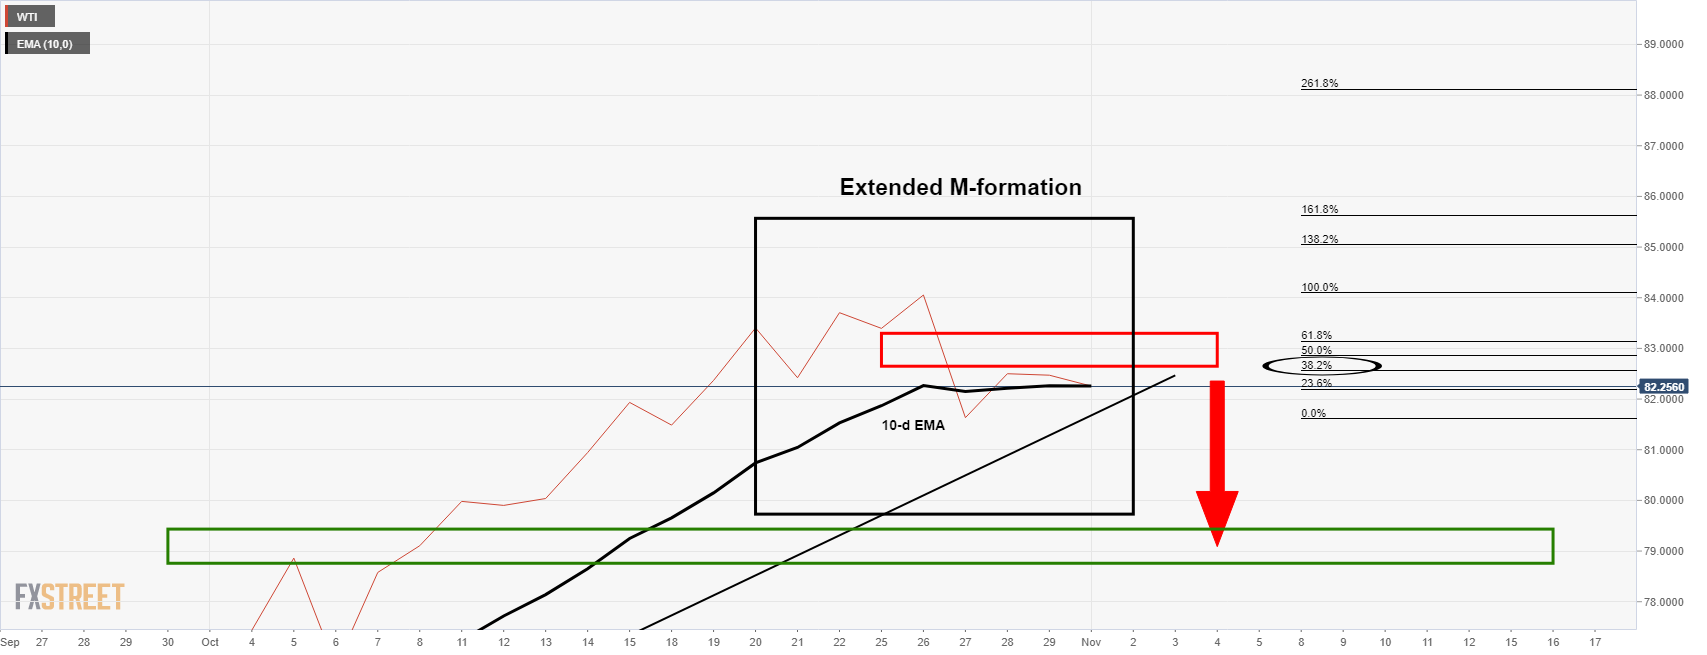
The 38.2% Fibonacci also has a confluence of this resistance area which meets the 10-day EMA. A break below the 10-day EMA, as well as the trendline support, would be a highly bearish development for the day ahead. Bears could look to target the next major liquidity zone between 78.80 and 79 the figure.