- EUR/USD Price Analysis: Range bound within 1.0100-1.0260 since July 22
Notícias do Mercado
EUR/USD Price Analysis: Range bound within 1.0100-1.0260 since July 22
- The EUR/USD is set to finish the week almost flat, gaining 0.05%.
- The shared currency daily chart is neutral-to-downwards, but the hourly is neutral-to-upwards.
- EUR/USD Price Analysis: A daily close above 1.0200 could pave the way towards 1.0300; otherwise, it might drop towards 1.0096.
The EUR/USD is trading at 1.0220, after hitting a daily high at 1.0254, but later tumbled towards the daily low at 1.0145 on elevated US inflation data. In June, the Personal Consumption Expenditures (PCE) rose by 6.8% YoY, fueling expectations of additional Federal Reserve rate hikes, despite the market's pricing in only 80 bps of tightening.
EUR/USD Price Analysis: Technical outlook
From a daily chart perspective, the EUR/USD remains neutral-to-downward biased, helped by the 20-day EMA lying below the exchange rate at 1.0167. Nevertheless, the EUR/USD, unable to capitalize on an upbeat market mood, and broad US dollar weakness, keeps the shared currency exposed to further selling pressure. If EUR/USD buyers want to shift the bias to neutral, they must reclaim the May 13 low-turned-resistance at 1.0348. Once cleared, a challenge of the 50-day EMA at 1.0423 is on the cards. On the other hand, if EUR/USD sellers achieve a daily close below 1.0200, that would pave the road towards 1.0096.
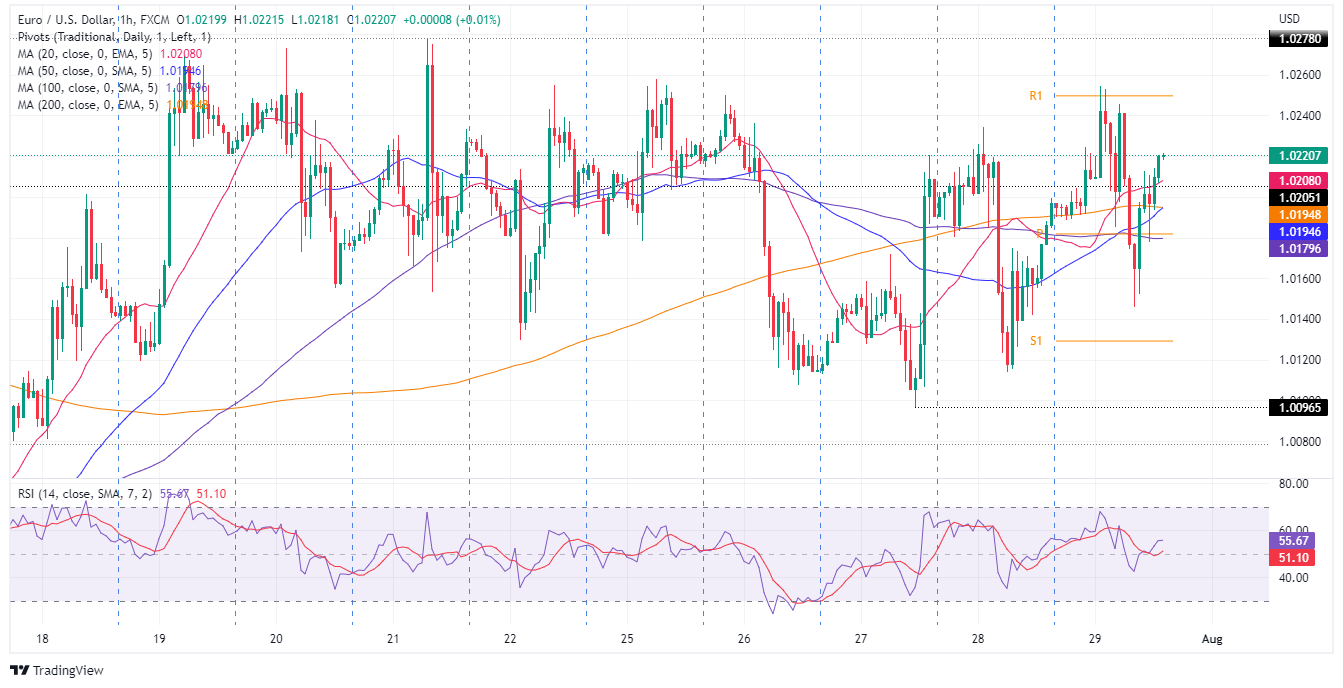
EUR/USD 1-hour chart
In the near term, the EUR/USD hourly chart depicts a sideways picture in the major. Since July 19, the EUR/USD has been trading in the 1.0096-1.0278 range, unable to break either side of the trading range, but EUR/USD traders should notice that the hourly EMAs sit below the spot price, signaling that buying pressure might be building.
Therefore, the EUR/USD first resistance would be the R1 daily pivot at 1.0250. Once cleared, the next resistance would be 1.0278, followed by 1.0300. On the flip side, the EUR/USD first support would be the 20-hour EMA at 1.0206. Break below will expose the confluence of the 200 and 50-hours EMAs at around 1.0192-94, followed by the 100-hour EMA at 1.0179.
EUR/USD Key Technical Levels