- AUD/JPY Price Analysis: Bounce could be short-lived with sellers piling near the 200-hour EMA
Notícias do Mercado
AUD/JPY Price Analysis: Bounce could be short-lived with sellers piling near the 200-hour EMA
- AUD/JPY climbs almost 0.07% as the Asian session begins.
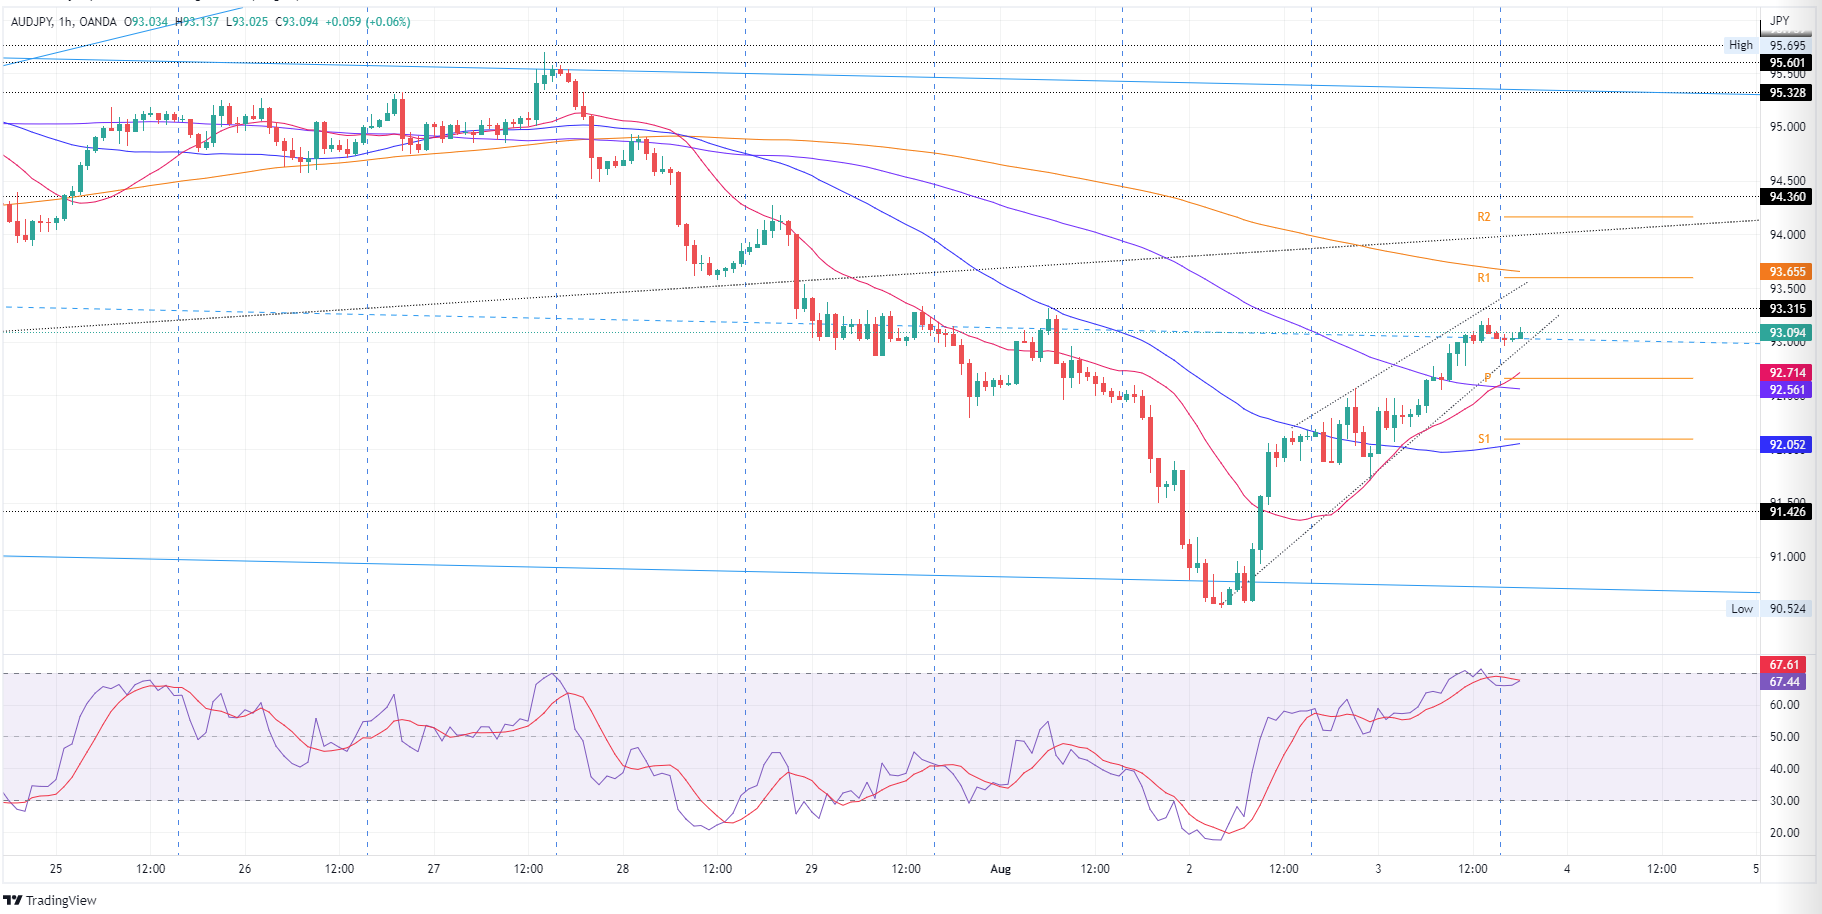
- An ascending wedge in the hourly chart might exert downward pressure on the pair.
- A break above 93.30 will find solid resistance around 93.70-85.
The AUD/JPY snaps four straight days of losses and escalates above the 100-day EMA at 92.73 as the Asian Pacific session begins. On Wednesday, the AUD/JPY started trading near the day’s lows at 91.72 before rallying towards the daily high at 93.225, for a gain of almost 150 pips. At the time of writing, the AUD/JPY is trading at 93.09.
AUD/JPY Price Analysis: Technical outlook
In the daily chart, the AUD/JPY trades within the boundaries of a descending channel and sits at the mid-central line, shy of the August 3 high at 93.22. Although the price is above the 100-day EMA, keeping the neutral-to-upwards bias intact, the Relative Strength Index (RSI) oscillates in bearish territory, signaling sellers could be leaning around the aforementioned area.
A break above 93.23 would pave the way for buyers to test the confluence of the 20 and 50-day EMAs around 93.73-82.
Otherwise, if AUD/JPY buyers struggle and the pair tumbles below 93.00, a fall towards the 100-day EMA at 92.73 is on the cards.
AUD/JPY 1-hour chart
In the near term, the AUD/JPY is neutral to downwards biased. Worth noting that although trending up for the last couple of days, price action formed an ascending-wedge, with bearish implications. Additionally, AUD/JPY sellers are lurking around solid resistance in the 93.31-93.60 area, a confluence of the August 1 high and the 200-hour EMA.
A break below the ascending-wedge bottom trendline will exacerbate a fall towards the daily pivot at 92.70. Once cleared, the cross could tumble towards the confluence of the S1 pivot and the 50-hour EMA at 92.05.

AUD/JPY Key Technical Levels