- Silver Price Analysis: XAG/USD struggles for direction, stuck in a range above $20.00
Notícias do Mercado
Silver Price Analysis: XAG/USD struggles for direction, stuck in a range above $20.00
- Silver oscillates in a narrow trading band above the $20.00 round-figure mark on Friday.
- The technical set-up favour bulls and supports prospects for a further appreciating move.
- A convincing break below the $19.20 area is needed to negate any near-term positive bias.
Silver struggles to gain any meaningful traction on Friday and remains confined in a narrow range through the early European session. The white metal is currently hovering in neutral territory and so far, has managed to hold above the $20.00 psychological mark.
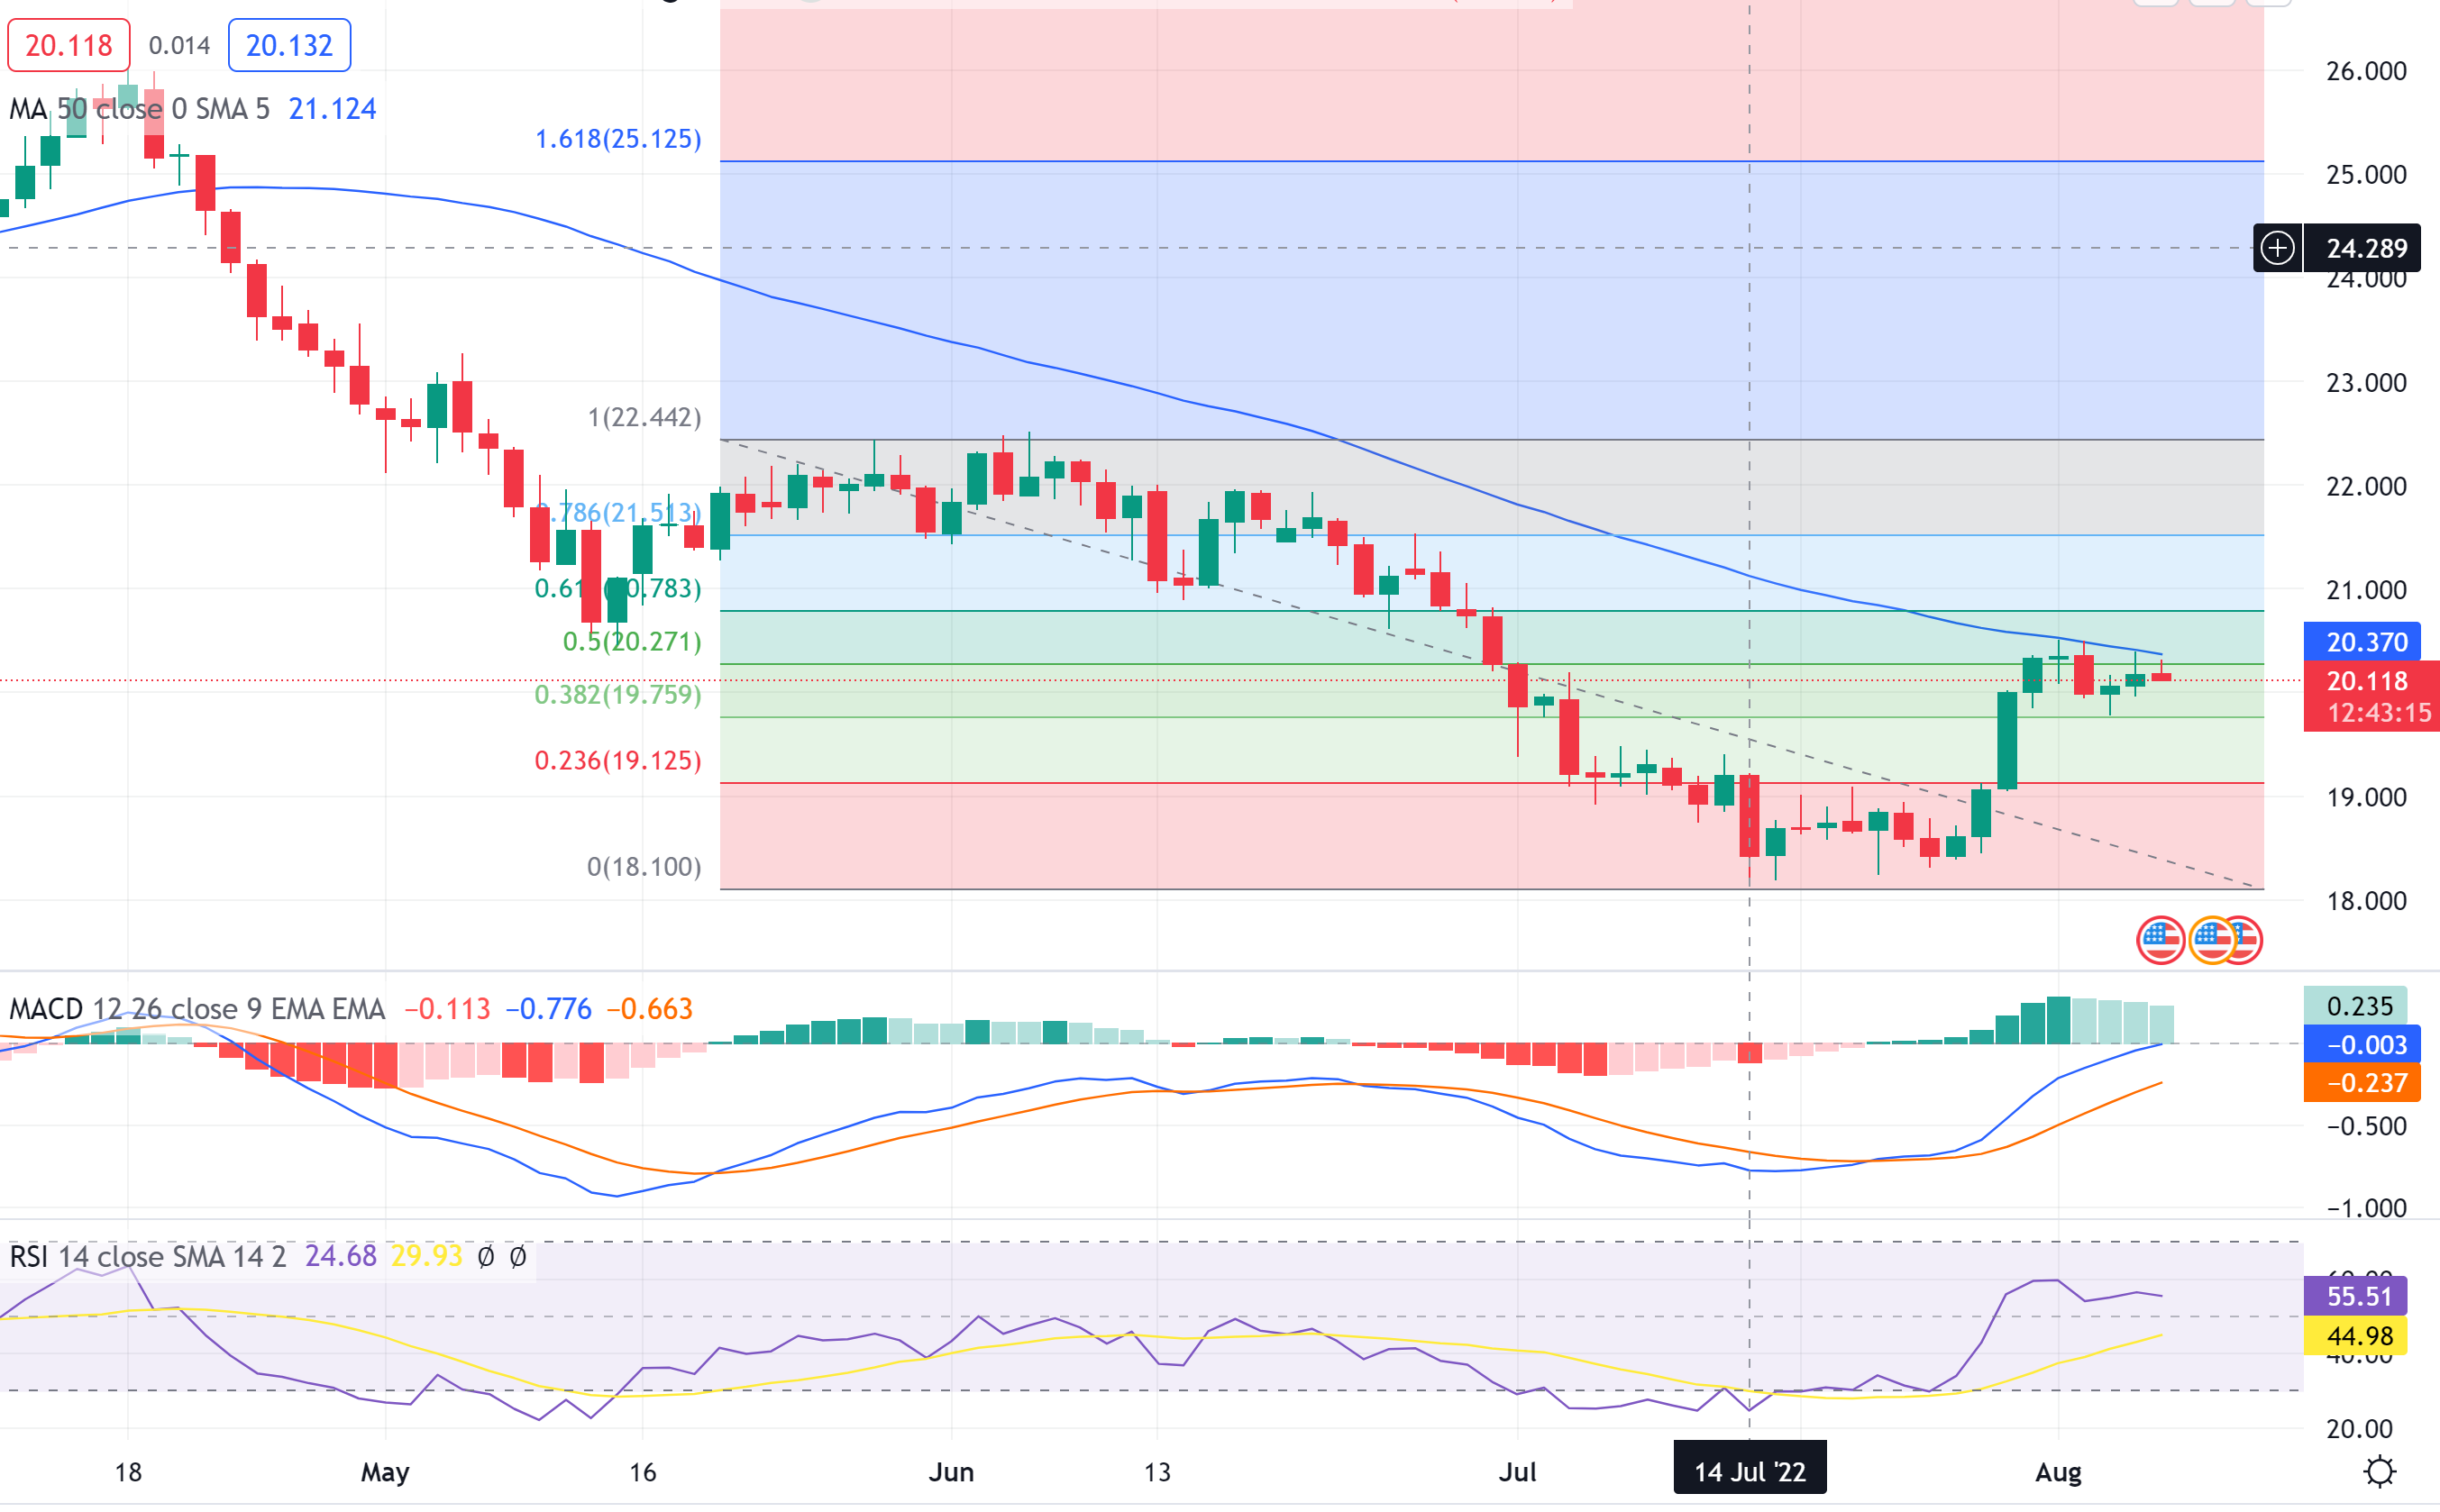
From a technical perspective, any subsequent move up is likely to confront stiff resistance near the mid-$20.00s confluence. The said barrier comprises the 50-day SMA and the 50% Fibonacci retracement level of the $22.52-$18.15 downfall, which should now act as a key pivotal point.
Positive oscillators on hourly/daily charts, meanwhile, support prospects for an eventual breakout through the aforementioned confluence hurdle. Hence, a subsequent positive move could lift the XAG/USD towards the 61.8% Fibo. level, around the $20.85 area, en route to the $21.00 mark.
The momentum could further get extended towards the next relevant hurdle near the $21.40-$21.50 area before the XAG/USD eventually aims to reclaim the $22.00 mark. The latter coincides with the 100-day SMA, which if cleared decisively would be seen as a fresh trigger for bullish traders.
On the flip side, the weekly swing low, around the $19.80-$19.75 region, which coincides with the 38.2% Fibo. level now seems to act as immediate support. Any further decline is more likely to stall and find decent support near the 23.6% Fibo. level, around the $19.20 region.
Some follow-through selling, leading to a subsequent break below the $19.00 mark, would shift the bias back in favour of bearish traders. The XAG/USD could then fall to the $18.40 intermediate support en route to the YTD low, around the $18.15 region touched on July 14.
Silver daily chart

Key levels to watch