- GBP/JPY Price Analysis: Dwindles at the 20-DMA drops to the 163.00 figure
Notícias do Mercado
GBP/JPY Price Analysis: Dwindles at the 20-DMA drops to the 163.00 figure
- The GBP/JPY daily chart portrays the pair as neutral-to-downwards, pierce of 163.00, to send the pair towards the 163.10s area.
- From a short-term perspective, the GBP/JPY is range bound, but the higher-time frame could lean the pair neutral-to-downwards.
The GBP/JPS is almost flat as Tuesday’s Asian Pacific session begins, seesawing around the 100-day EMA after hitting the weekly high at 163.84 on Monday. At the time of writing, the GBP/JPY is trading at 163.06, amid a risk-off mood as shown by Asian futures preparing to open lower.
GBP/JPY Price Analysis: Technical outlook
The GBP/JPY daily chart shows the pound remains heavy, albeit finishing Monday’s session with gains. Nevertheless, buyers’ inability to breach the 20-day EMA at 136.64 opened the door for sellers, who stepped in, sending the cross-currency diving towards the 163.00 figure. All that said, the pair is neutral-to-bearish biased.
Therefore, the GBP/JPY’s first support would be the August 8 low at 162.56. Break below will expose the August 5 low at 161.11, followed by the August 2 swing low at 159.44. Otherwise, if buyers reclaim the 20-day EMA at 163.64, that would open the door for a test of the 50-day EMA at 164.21.
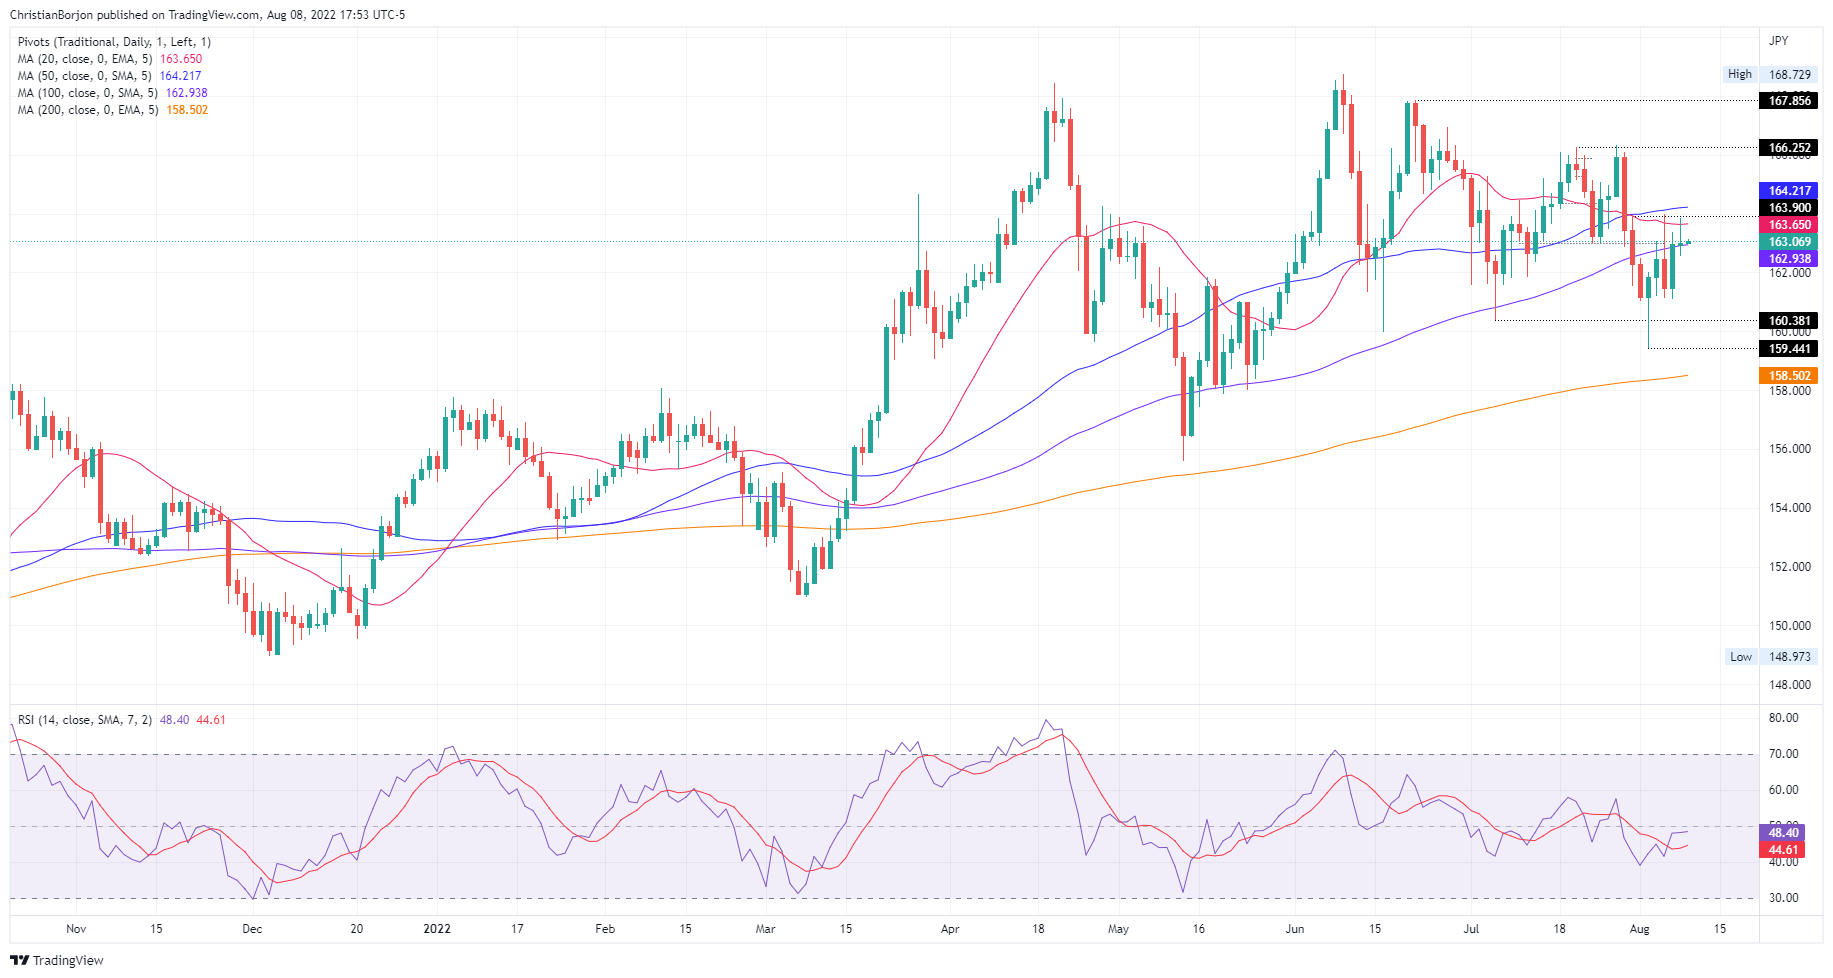 GBP/JPY Daily chart
The cross-currency pair is neutral biased from a short-term perspective, capped by the August 5 low and the August 8 high, at 161.11-163.84, respectively. Additionally, the Relative Strength Index (RSI), is almost flat, just above the 50-midline, but directionless. Therefore, a break above 163.84 could send the pair towards the August 4 high at 163.97, which, once cleared, could open the door for further gains. On the flip side, the GBP/JPY first support would be a busy support area, with the intersection of the 50, 200, and 100-hour EMAs around the 162.49-162.65. Once cleared, the next support would be the S2 pivot point at 161.86, followed by the S3 daily pivot at 161.16.
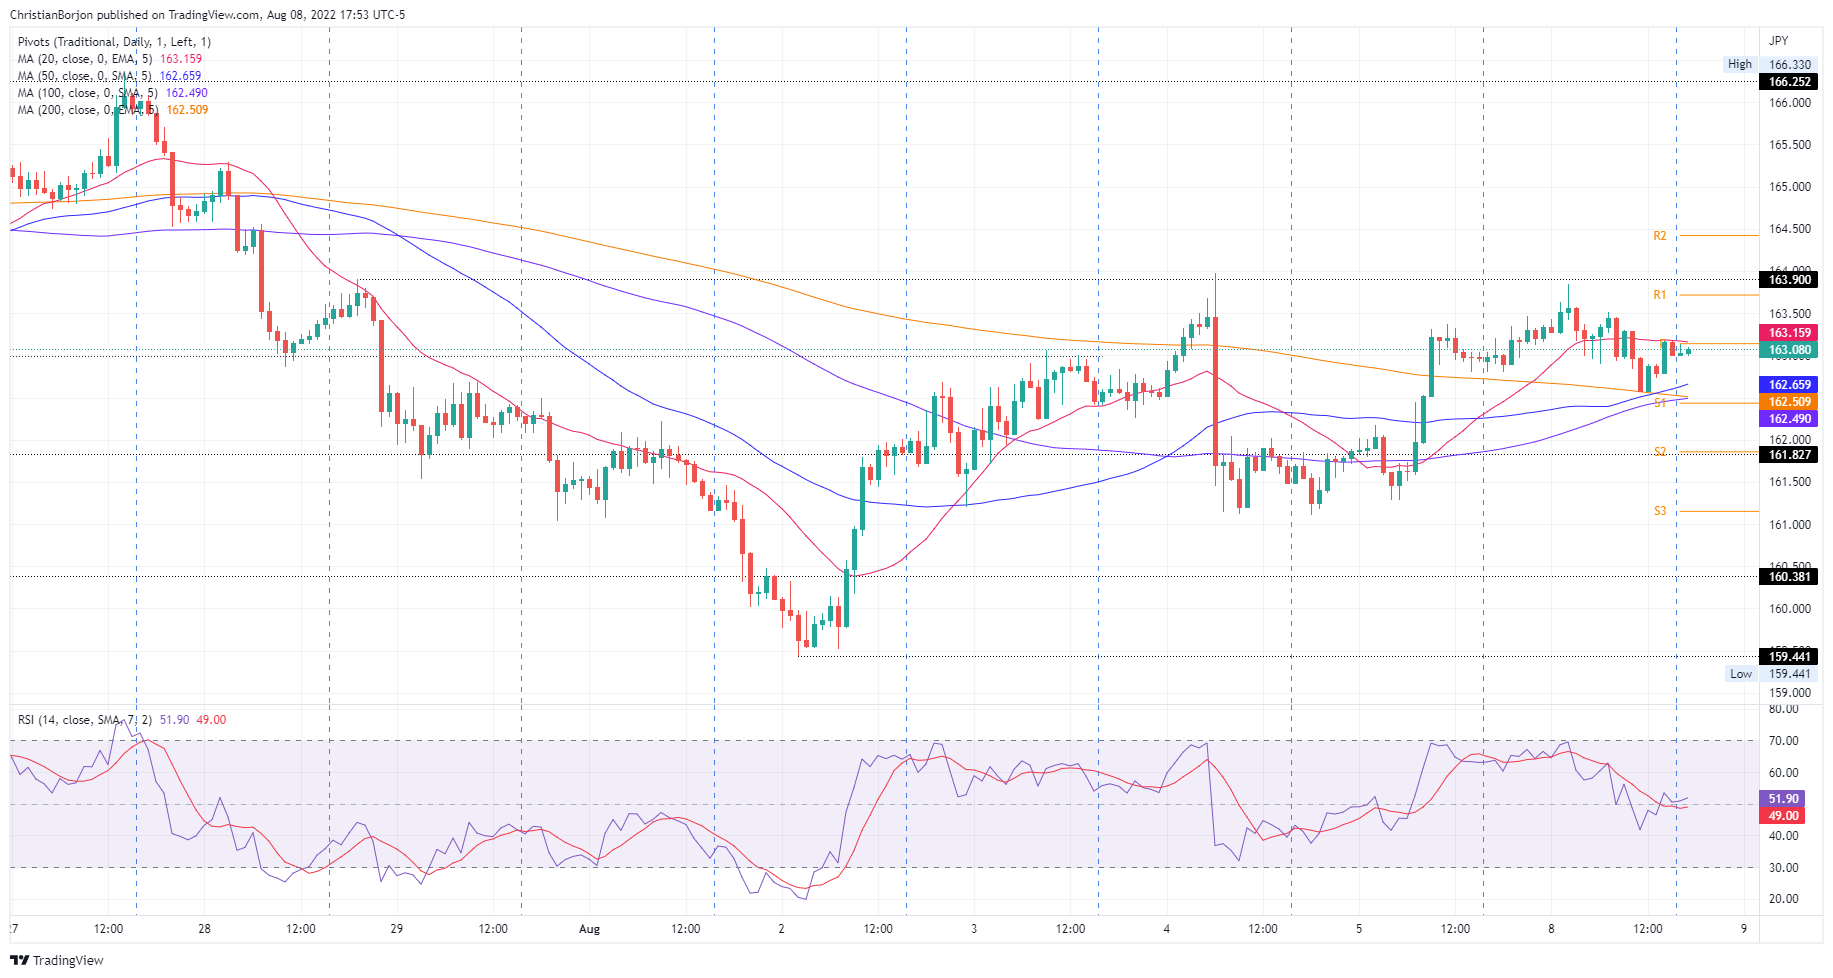 GBP/JPY Hourly chart
GBP/JPY Key Technical Levels