- USD/CAD Price Analysis: Bulls could be about to clean up
Notícias do Mercado
USD/CAD Price Analysis: Bulls could be about to clean up
- USD/CAD bulls have started to move in for the kill.
- A phase of accumulation could be playing out in the lower time frames.
USD/CAD has stalled in the sell-off which gives rise to the prospects of a bullish continuation. The following illustrates this from a daily, hourly and the 15-minute time frame perspective.
USD/CAD daily chart
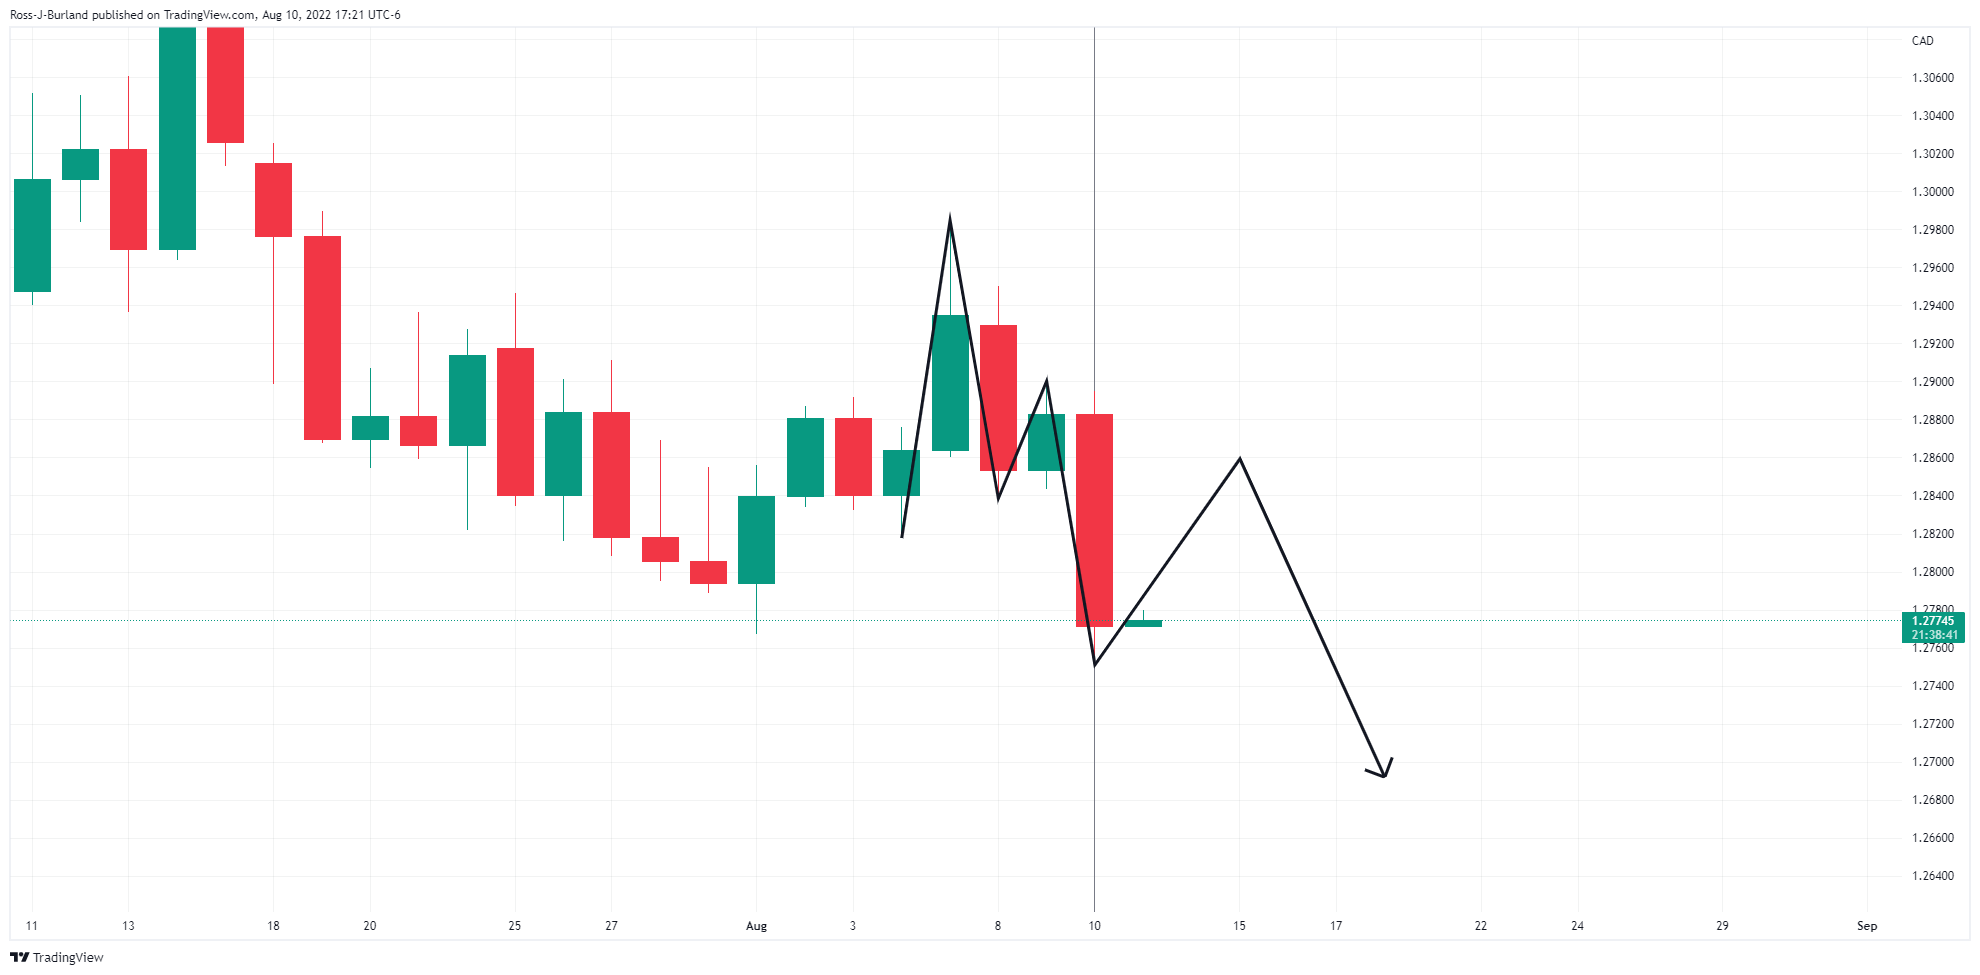
The daily chart's M-formation is compelling as this is a reversion pattern that could see the price pulled back into the neckline of the 'M' in the coming sessions. the optimal entry point will be dependent on the forthcoming price action and dependent on a lower time frame break of structure.
USD/CAD H1 chart
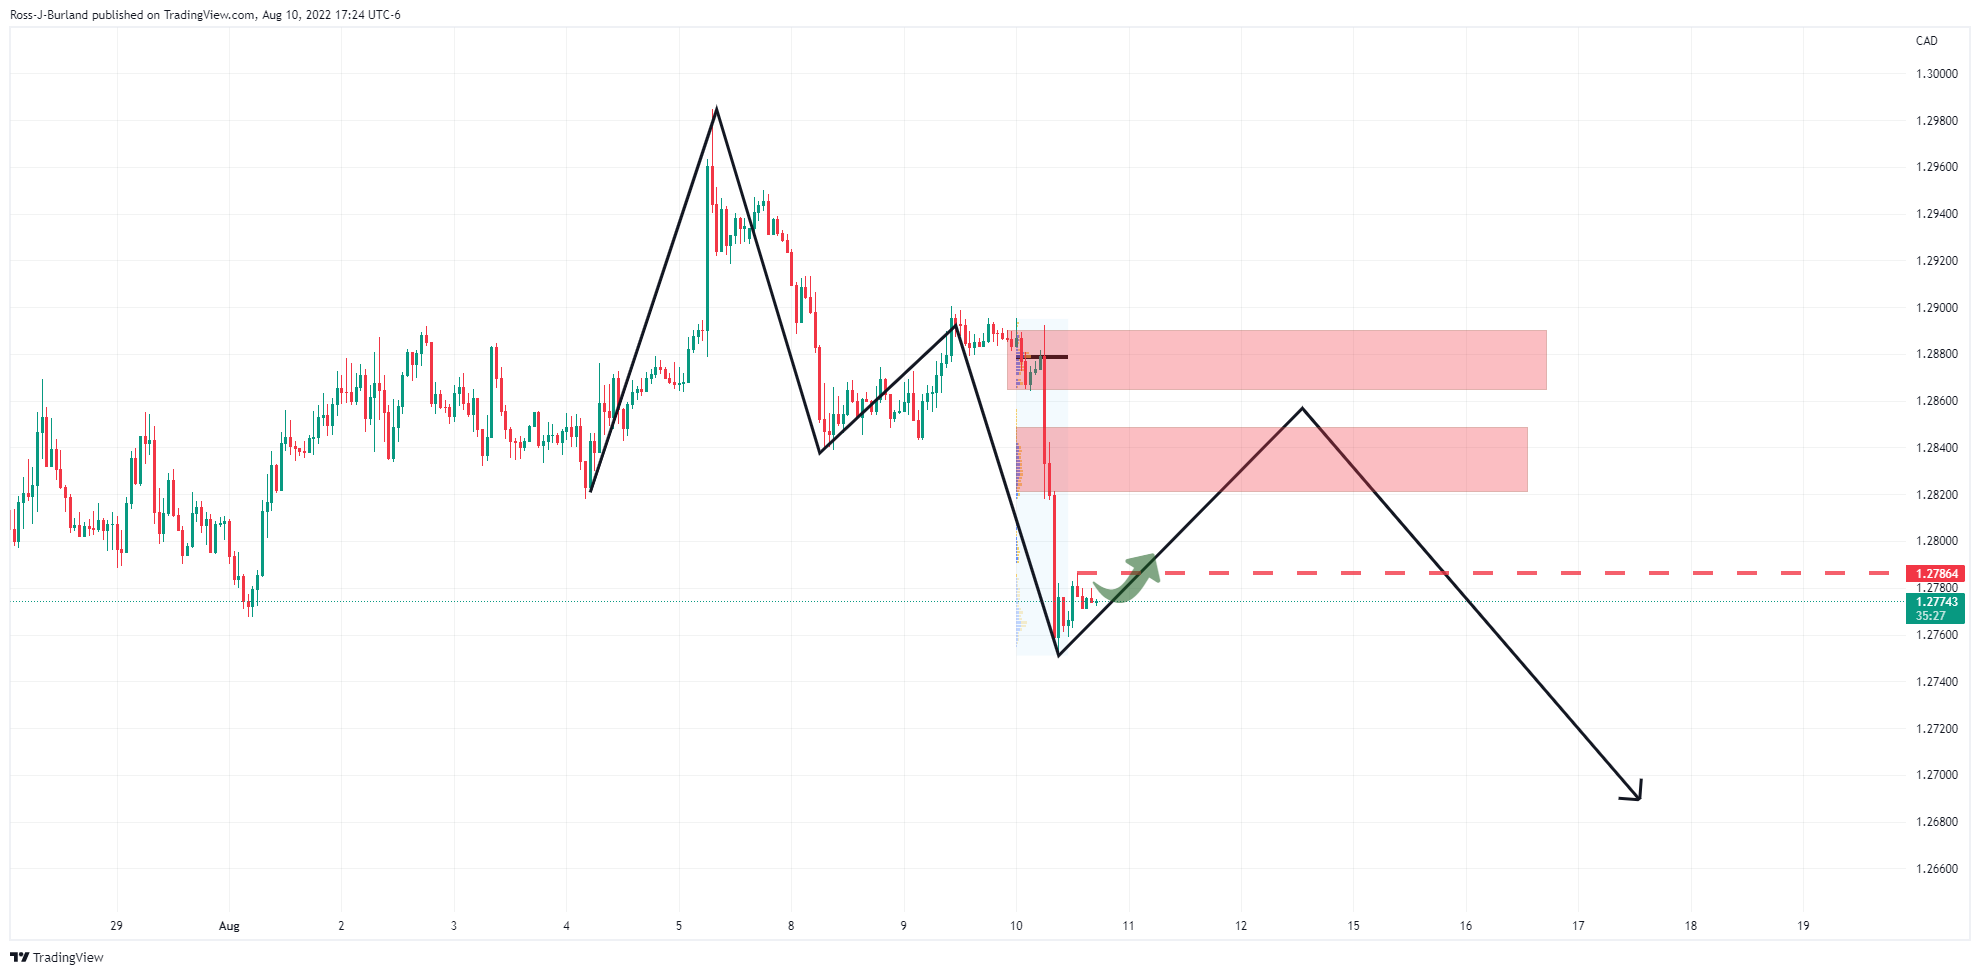
The hourly chart shows that the price has made a recent corrective high. The bulls will want to see this cleared before thinking about engaging as it will signal a higher probability that the sell-off is indeed decelerating.
USD/CAD M15 chart
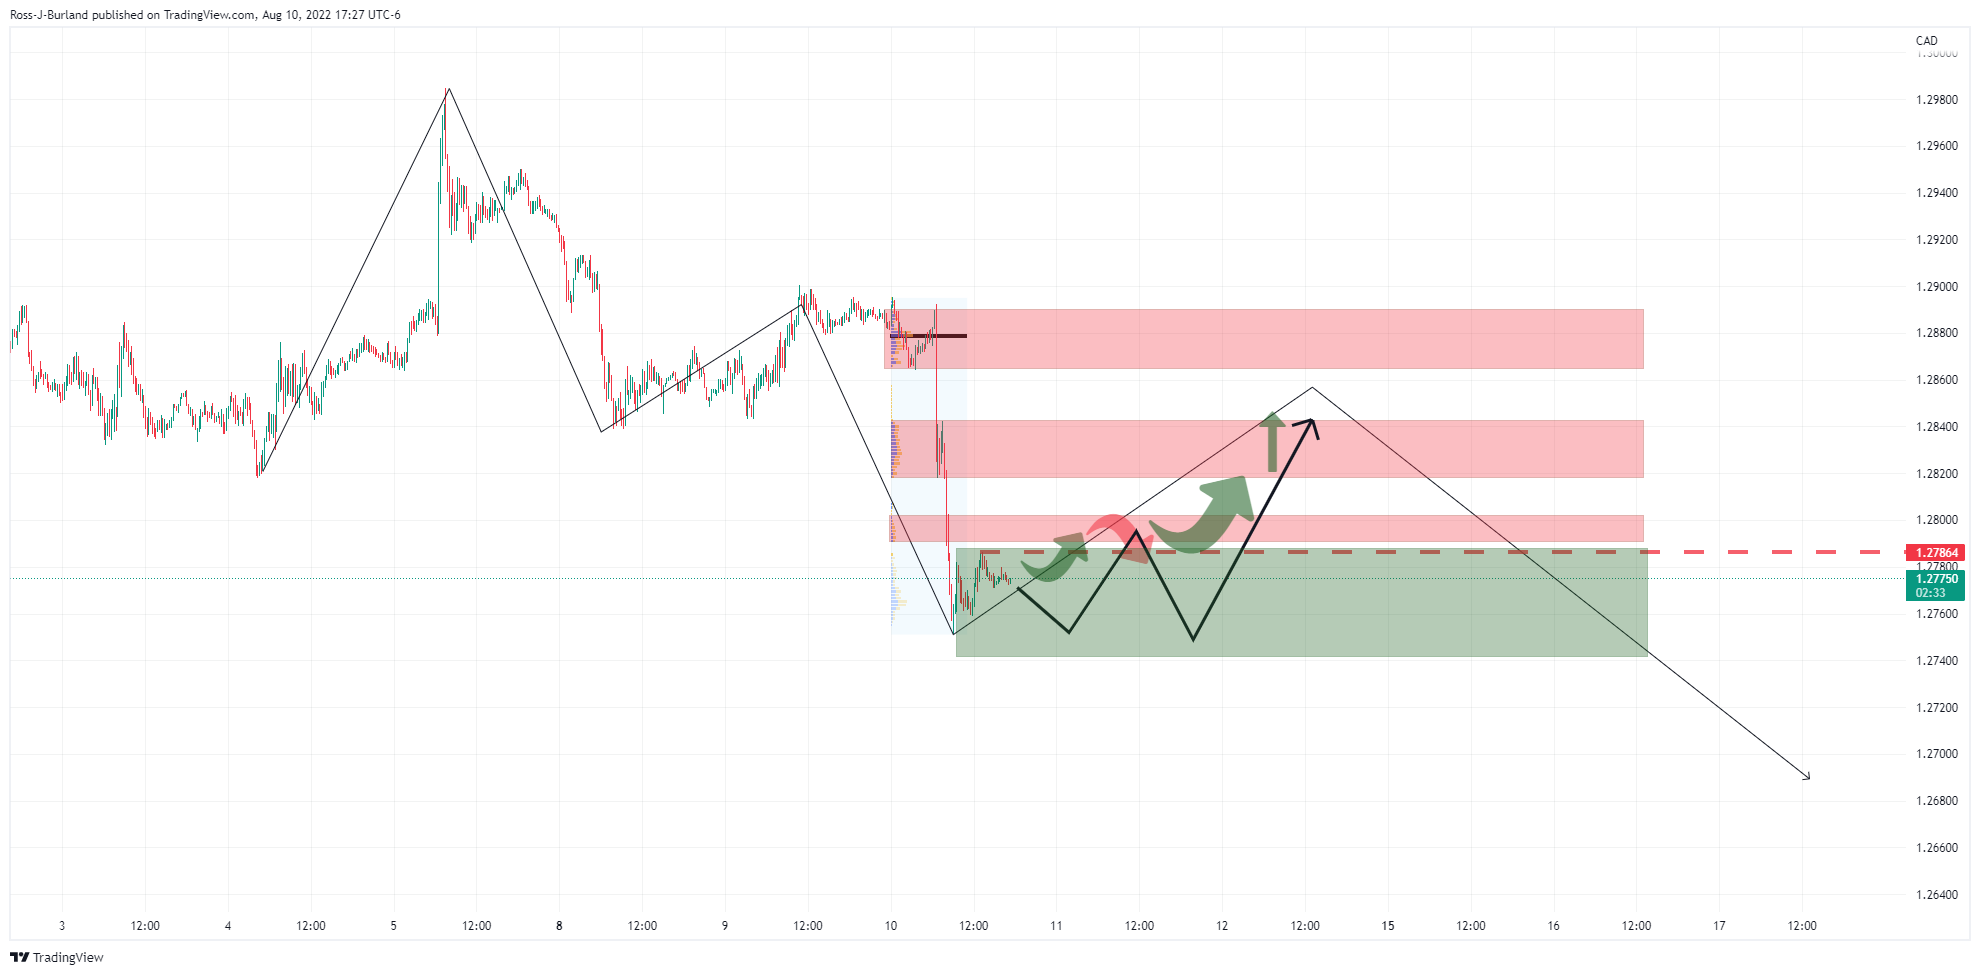
From a 15-min perspective, the price action could develop over the coming sessions as follows. In a fast market, the price would be expected to correct steeply, but in a long drawn-out process in which there is a lack of commitment from the bulls, the ride could be a bumpy one along the support area as illustrated above. This would potentially result in an even lower low yet to come before the bulls fully commit to the correction in a phase of accumulation.