- Gold Price Forecast: XAU/USD needs a break below $1,784 to extend the correction – Confluence Detector
Notícias do Mercado
Gold Price Forecast: XAU/USD needs a break below $1,784 to extend the correction – Confluence Detector
- Gold price fails to capitalize on broad US dollar weakness and sluggish Treasury yields.
- US CPI data shows the first sign of peak inflation but not enough to dissuade hawkish Fed.
- XAU/USD bears could extend control below the key $1,784 support.
Gold price is keeping the corrective momentum intact, as it remains below the $1,800 mark. The bright metal is on its retreat from monthly highs of $1,808 after softer US inflation triggered a sharp sell-off in the dollar alongside the Treasury yields. Odds of a 75 bps September Fed rate hike have dropped to nearly 43% vs. 68% seen pre-inflation data release. The greenback is resuming its downtrend this Thursday, as markets continue to believe that a one-time softening in the price pressure is unlikely to dissuade the Fed from altering its monetary policy course. Therefore, the non-interest-bearing gold remains under pressure, helped by sluggish price action in the yields. Although the downside appears cushioned (for now) amid resurfacing US-China trade tensions and renewed covid lockdowns in some of the Chinese cities and towns.
Also read: Gold Price Forecast: Bear cross outweighs softer US inflation, 50 DMA support at risk
Gold Price: Key levels to watch
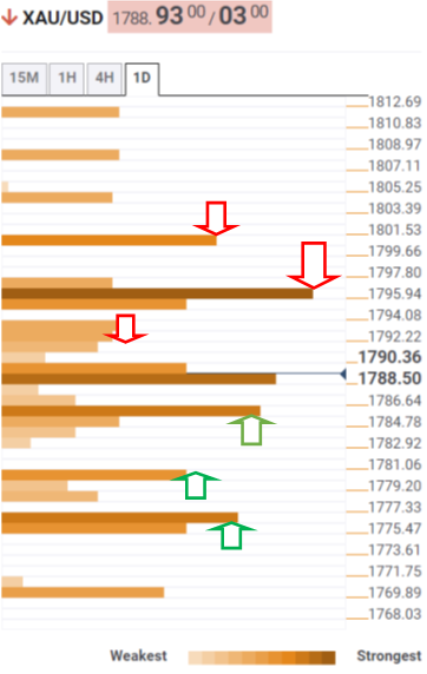
The Technical Confluence Detector shows that the gold price is challenging the $1,787 support, which is the SMA5 one-day and the previous day’s low.
The next crucial downside cap for XAU/USD is aligned at $1,784, the convergence of the SMA50 one-day and the Fibonacci 23.6% one-week.
Should sellers manage to find a strong foothold below the latter, a fresh drop towards the Fibonacci 38.2% one-week at $1,780 will be on the table.
The line in the sand for gold bulls is seen at the confluence of the SMA10 one-day and the pivot point one-day S2 at $1,775.
On the upside, Fibonacci 23.6% one-day at $1,792 guards the immediate upside, above which the $1,795 supply zone will be tested. That area is the intersection of the Fibonacci 38.2% one-day, the previous week’s high and the pivot point one-week R1.
Bulls will then target the Fibonacci 61.8% one-day at $1,800, bringing the monthly high of $1,808 back in sight.
Here is how it looks on the tool
About Technical Confluences Detector
The TCD (Technical Confluences Detector) is a tool to locate and point out those price levels where there is a congestion of indicators, moving averages, Fibonacci levels, Pivot Points, etc. If you are a short-term trader, you will find entry points for counter-trend strategies and hunt a few points at a time. If you are a medium-to-long-term trader, this tool will allow you to know in advance the price levels where a medium-to-long-term trend may stop and rest, where to unwind positions, or where to increase your position size.