- USD/CHF Price Analysis: Surrenders the 200-DMA as sellers eye 0.9200
Notícias do Mercado
USD/CHF Price Analysis: Surrenders the 200-DMA as sellers eye 0.9200
- USD/CHF broke below the 200-DMA, ending the major’s upward bias.
- In the near term, the USD/CHF is neutral to downwards, but buyers reclaiming 0.9450 exerts upward pressure on the major.
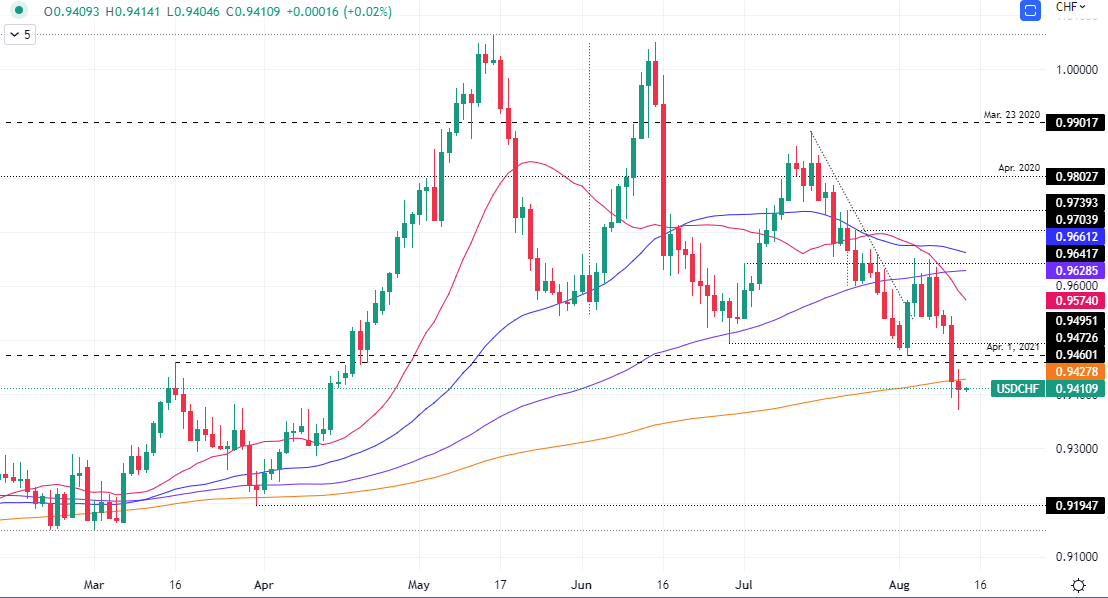
The USD/CHF stumbles for the sixth consecutive day and breaks support provided by the 200-DMA at 0.9427, shifting the major’s bias downwards, with sellers reclaiming the latter, extending the USD/CHF losses in the week to 2.17%. At the time of writing, the USD/CHF is trading at 0.9408.
USD/CHF Price Analysis: Technical outlook
From a daily chart perspective, although breaking below the 200-day EMA, the USD/CHF risks are skewed to the upside. Thursday’s price action formed a hammer, preceded by a downtrend. That said, the major might re-test the 200-day EMA as a resistance level. If the latter holds, that could pave the way towards the March 31 low at 0.9194.
 USD/CHF Daily chart
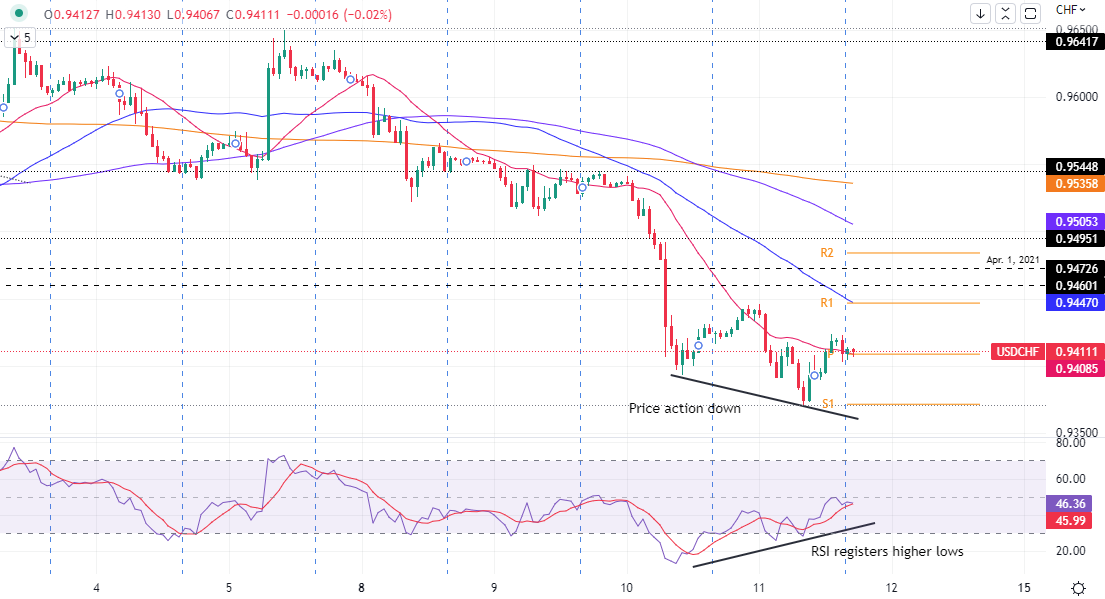
Zooming into the one-hour scale, the USD//CHF chart portrays the pair as neutral-to-downwards, but a positive divergence between the RSI and price action suggests an upward correction is on the cards. If that scenario plays out, the USD/CHF first resistance would be the confluence of the 50-hour EMA and the R1 pivot at 0.9447. Break above will expose the R2 daily pivot at 0.9484, followed by 0.9500.
 USD/CHF 1-hour chart
USD/CHF Key Technical Levels