- USD/JPY Price Analysis: Soars and reclaims 134.00, eyeing 135.00
Notícias do Mercado
USD/JPY Price Analysis: Soars and reclaims 134.00, eyeing 135.00
- USD/JPY bounces off weekly lows around 132.50, underpinned by high US bond yields.
- The major faces solid resistance around 134.50-65; once cleared, a jump to 135.00 is on the cards.
- In the near term, a USD/JPY pullback towards the 133.50-60 area is on the cards before resuming upwards.
The USD/JPY jumps from around weekly lows to a crowded resistance area, with the 20-day EMA at 134.62, alongside a downslope resistance trendline, drawn from July tops (also the YTD highs), which passes near the 20-DMA. At the time of writing, the USD/JPY is trading at 134.27.
USD/JPY Price Analysis: Technical outlook
From a daily chart perspective, the major bias is neutral-upward biased, but a wall of resistance is emerging ahead of the 135.00 figure. However, the RSI crossing above its 7-day RSI SMA, also about to cross over the 50-midline, illustrates buying pressure is mounting on the pair. That, alongside higher US Treasury bond yields, can underpin the USD/JPY towards higher prices.
Therefore, the USD/JPY’s first resistance would be the 20-day EMA. Once broken, its next resistance would be the 135.00 figure, followed by a test of the August MTD high at 135.58.
Zooming into the one-hour scale, the USD/JPY is upward-biased, but in the last hours, the pair retraced due to RSI’s entering overbought conditions. Hence, the major might print a leg down before resuming the higher-time frame uptrend towards 135.00 and beyond.
Therefore, the USD/JPY first support would be the 50% Fibonacci retracement at 133.81. Break below will expose the confluence of the 50-day EMA and the 61.8% Fibonacci retracement at 133.50-60. After that, the USD/JPY might resume upwards, towards the August 9 daily high at 135.30.
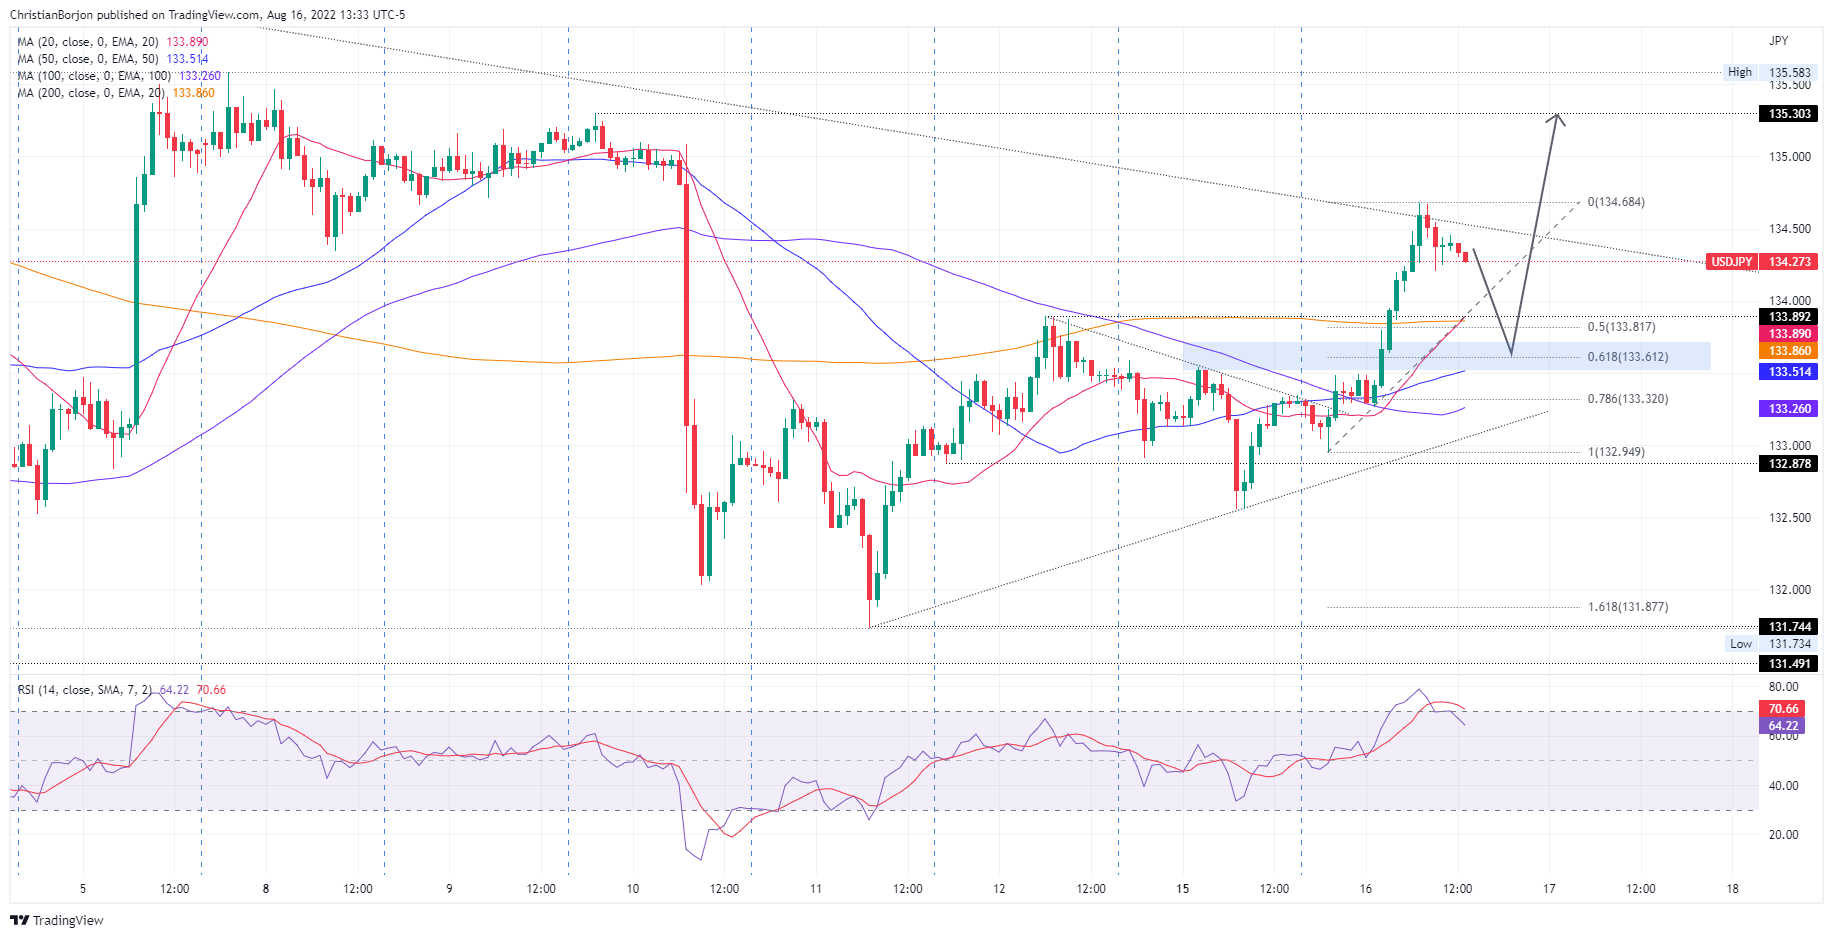
USD/JPY Hourly chart
USD/JPY Key Technical Levels