- GBP/JPY Price Analysis: Soars above the 162.00 figure, on risk-on impulse
Notícias do Mercado
GBP/JPY Price Analysis: Soars above the 162.00 figure, on risk-on impulse
- GBP/JPY eradicates Monday’s gains and gained more than 1% on Tuesday.
- The GBP/JPY is downward biased, but Tuesday’s price action opened the door for further upside, targeting the 50-DMA at 163.86.
The GBP/JPY pares Monday’s losses and some more, forming a bullish-engulfing candle pattern, meaning buyers overcome sellers, reciaiming the 162.00 figure on its way north. However, solid resistance lies ahead of the current exchange rate, with the 20 and 100-day EMAs hovering around the 162.80-163.00 area. At the time of writing, GBP/JPY is trading at 162.39.
GBP/JPY Price Analysis: Technical outlook
The cross-currency pair is exchanging hands below the 20, 100, and 50-day EMAs, suggesting that the GBP/JPY is downward biased. Nevertheless, Tuesday’s rally towards the 162.80-163.00 area, although rejected, it opened the door for further gains. So from a technical perspective, a break above the latter will put the 50-day EMA at 163.086 in play, ahead of the July 27 high at 166.33.
On the flip side, the GBP/JPY first support will be the 162.00 mark. Once cleared, the next support will be the figure at 161.00, ahead of the August 16 low at 160.08.
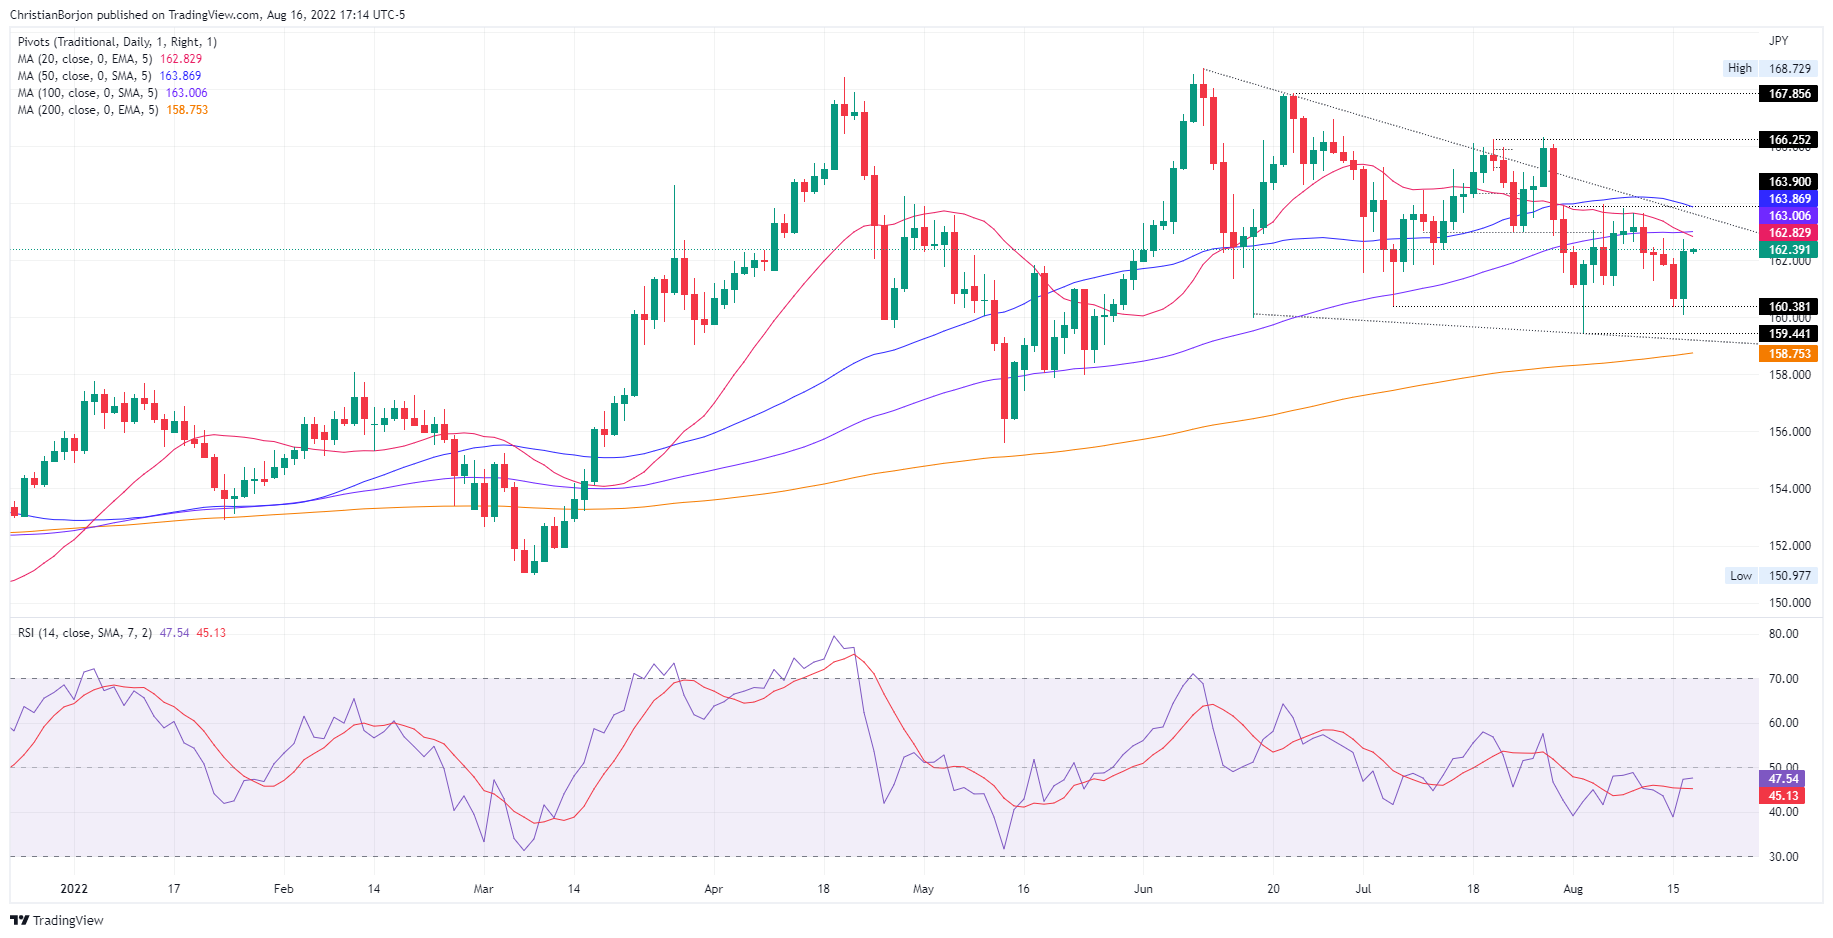
GBP/JPY Daily chart
GBP/JPY Key Technical Levels