- GBP/USD Price Analysis: Pokes weekly resistance line around 1.2100
Notícias do Mercado
GBP/USD Price Analysis: Pokes weekly resistance line around 1.2100
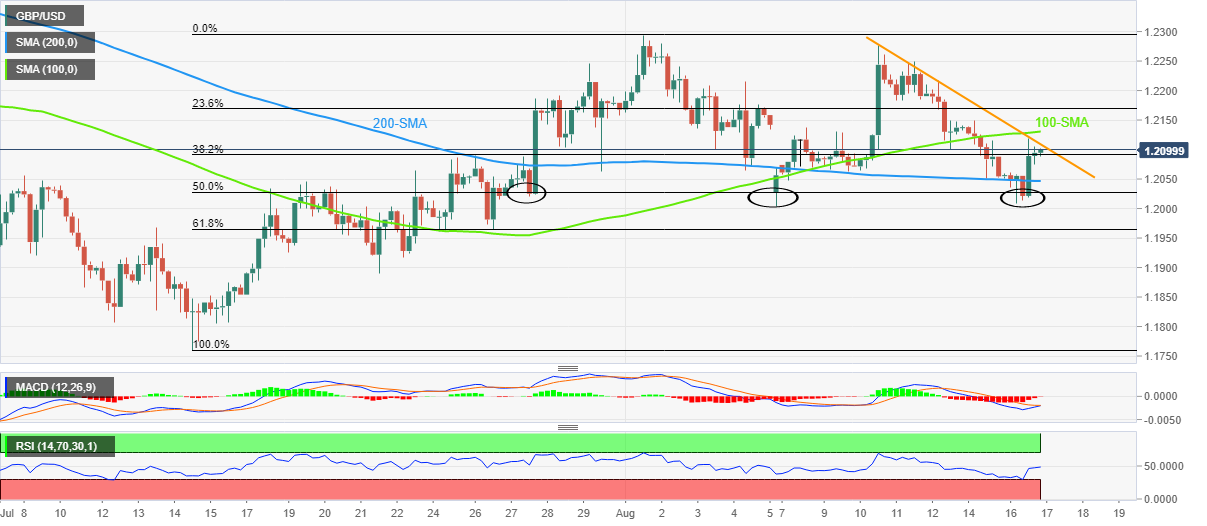
- GBP/USD keeps the previous day’s rebound, the consecutive third one from 50% Fibonacci retracement since late July.
- Steady RSI, impending bull cross on MACD teases buyers to overcome immediate hurdle.
- 100-SMA adds to the upside filters, multiple supports to challenge bears.
GBP/USD picks up bids to extend the previous day’s recovery to 1.2100 during Wednesday’s Asian session. In doing so, the Cable pair approaches a one-week-old resistance line while also portraying the third bounce off the 50% Fibonacci retracement level of July-August advances.
In addition to the sustained rebound from the key Fibonacci support, steady RSI and a looming bull cross of the MACD also keep the GBP/USD buyers hopeful of overcoming the 1.2110 immediate hurdle.
Even so, the 100-SMA level of 1.2130 acts as an extra filter to the north before giving control to the bulls.
Following that, the 1.2200 threshold may act as an intermediate halt during the run-up to the monthly high near 1.2295.
Alternatively, pullback moves may initially test the 200-SMA, around 1.2045 at the latest, before revisiting the 50% Fibonacci retracement level of 1.2030.
In a case where the GBP/USD bears keep reins past 1.2030 key support, the 61.8% Fibonacci retracement level and late July’s swing low, respectively around 1.1965 and 1.1890, will be in focus.
GBP/USD: Four-hour chart

Trend: Further upside expected