- GBP/USD Price Analysis: Bulls are trying to pick up a discount with focus on a correction
Notícias do Mercado
GBP/USD Price Analysis: Bulls are trying to pick up a discount with focus on a correction
- GBP/USD short-term time frame bulls are moving in and the focus is on a bullish correction.
- The daily chart, however, offers the prospects of a lower low for the day ahead.
GBP/USD is under pressure following a resurgence in the US dollar and the following illustrates the volatility seen around the Federal Open Market Committee minutes with two-way business around the 24-hour forex session on Thursday.
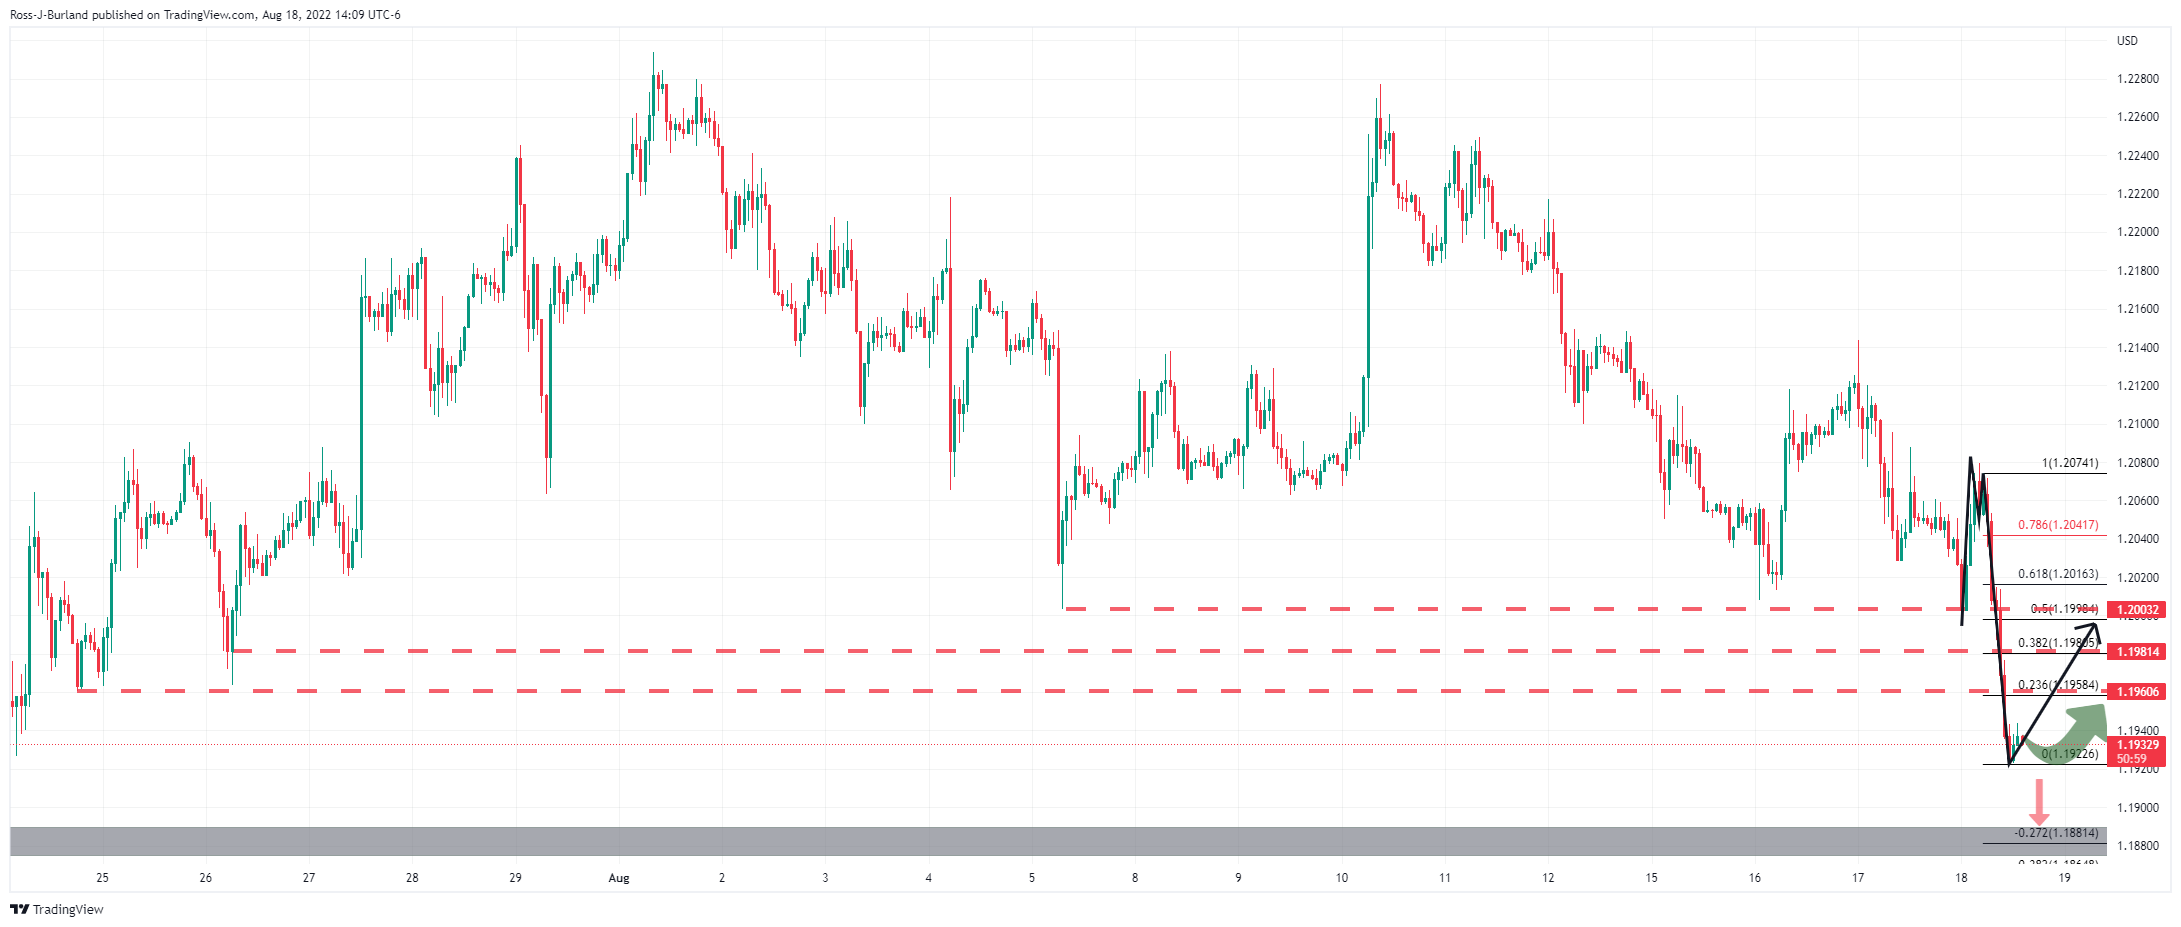
In the prior analysis, GBP/USD bulls correcting the price towards 1.2050 into the FOMC minutes, it was noted that the bulls were in play with eyes on a move higher in order to restest resistance and mitigate price imbalances on the hourly and 15-min charts respectively, and as follows:
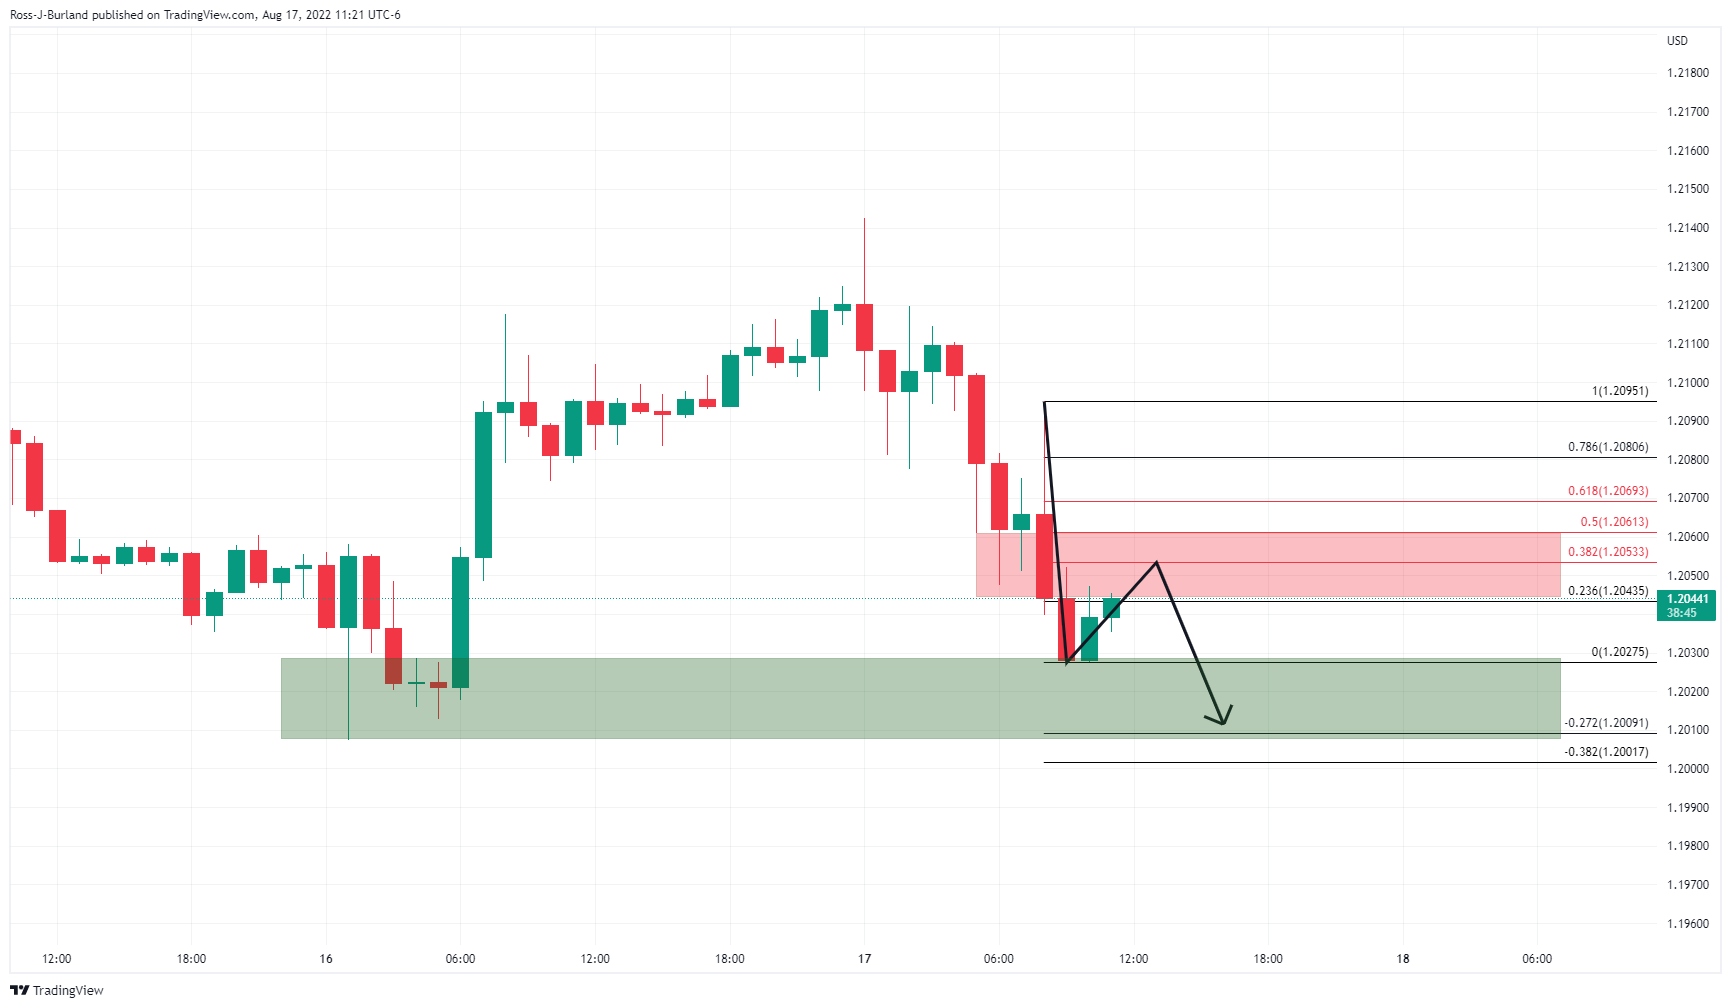
It was stated that the hourly chart, above, showed that the price could have been on the verge of a downside extension. However, it was also noted that it was in a corrective phase at the time of writing. The 15-minute charts identified areas of price imbalances, as per the greyed-out areas below:
This left a 38.2% ratio and the 50% mean reversion level vulnerable in and around the FOMC minutes.
GBP/USD live market
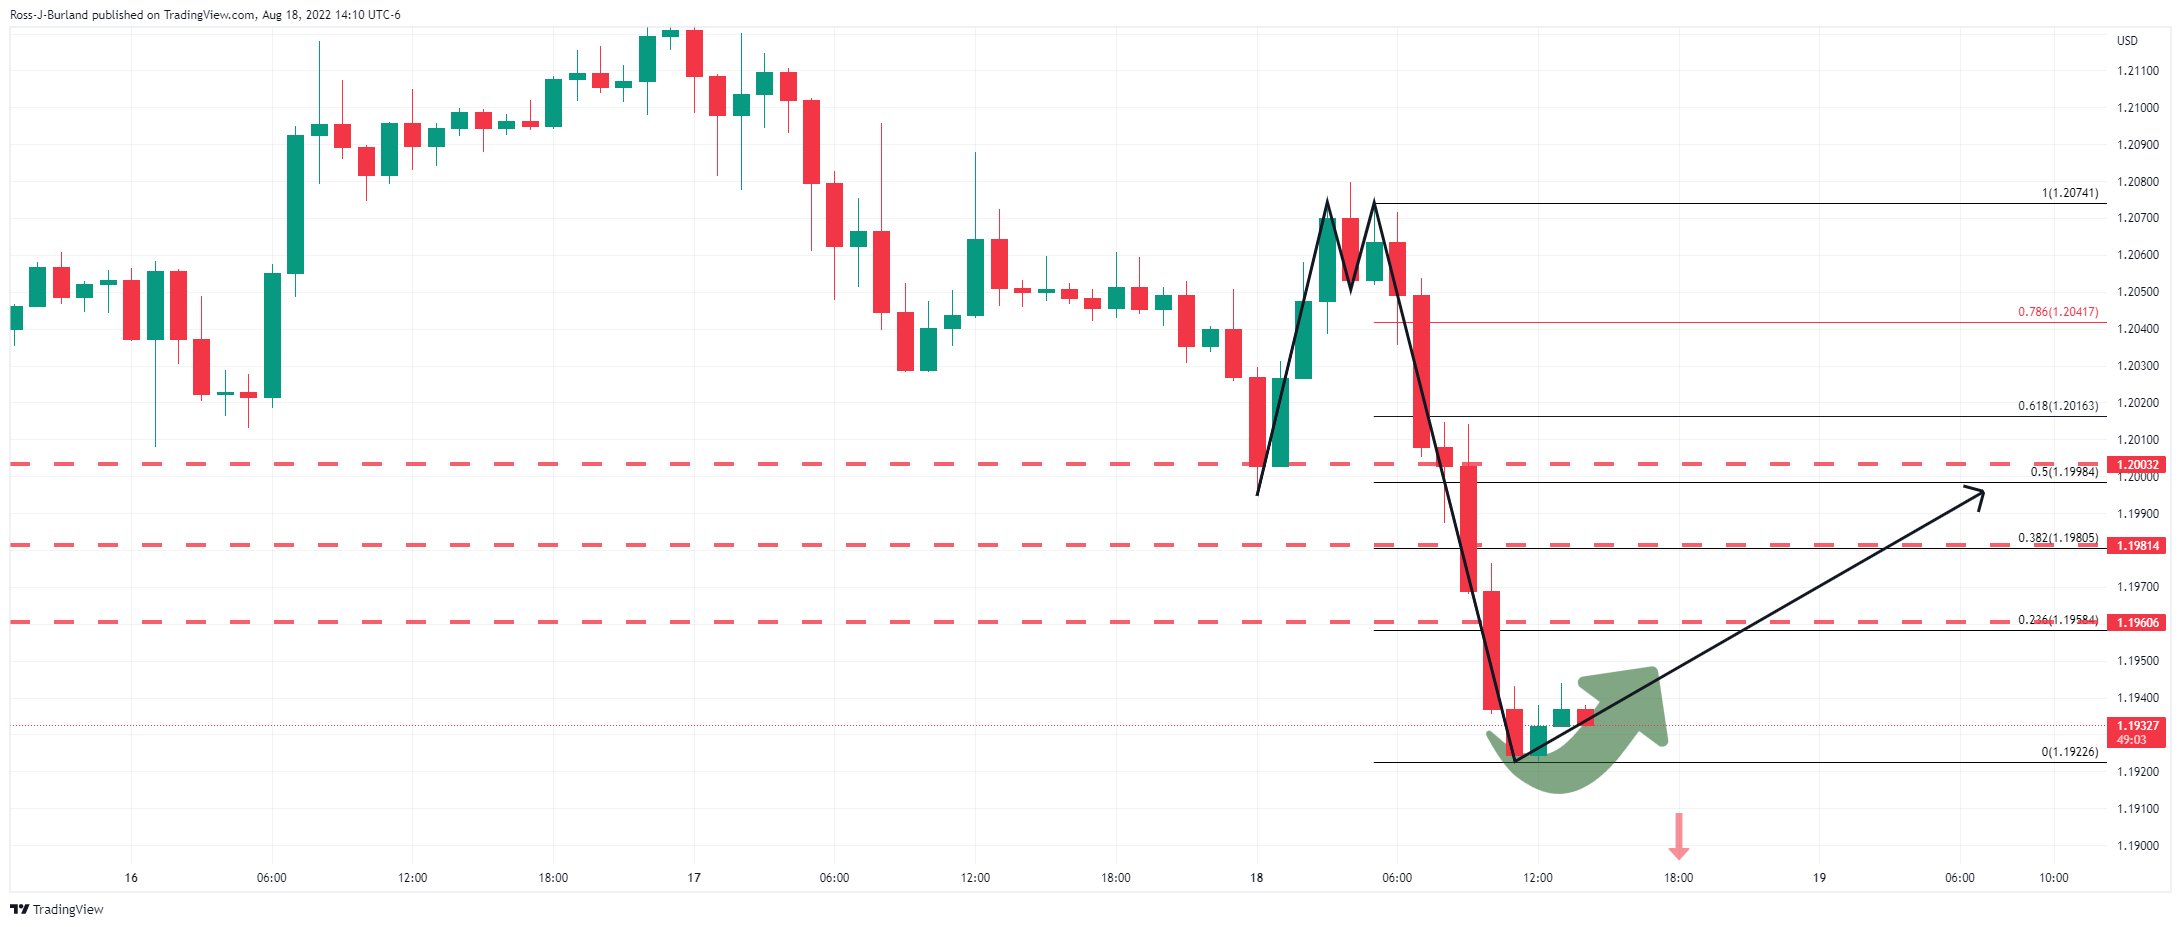
The price corrected higher, but the volatility and lack of structure have been a tricky one to navigate due to fake out after fakeout, at least on the hourly chart.
With that being said, the price is now starting to accumulate, so a potential reversion of the bearish impulse could be opening an opportunity for the day ahead. However, there is a caveat to this due to the prospects of a deeper move on the daily chart:
GBP/USD daily chart
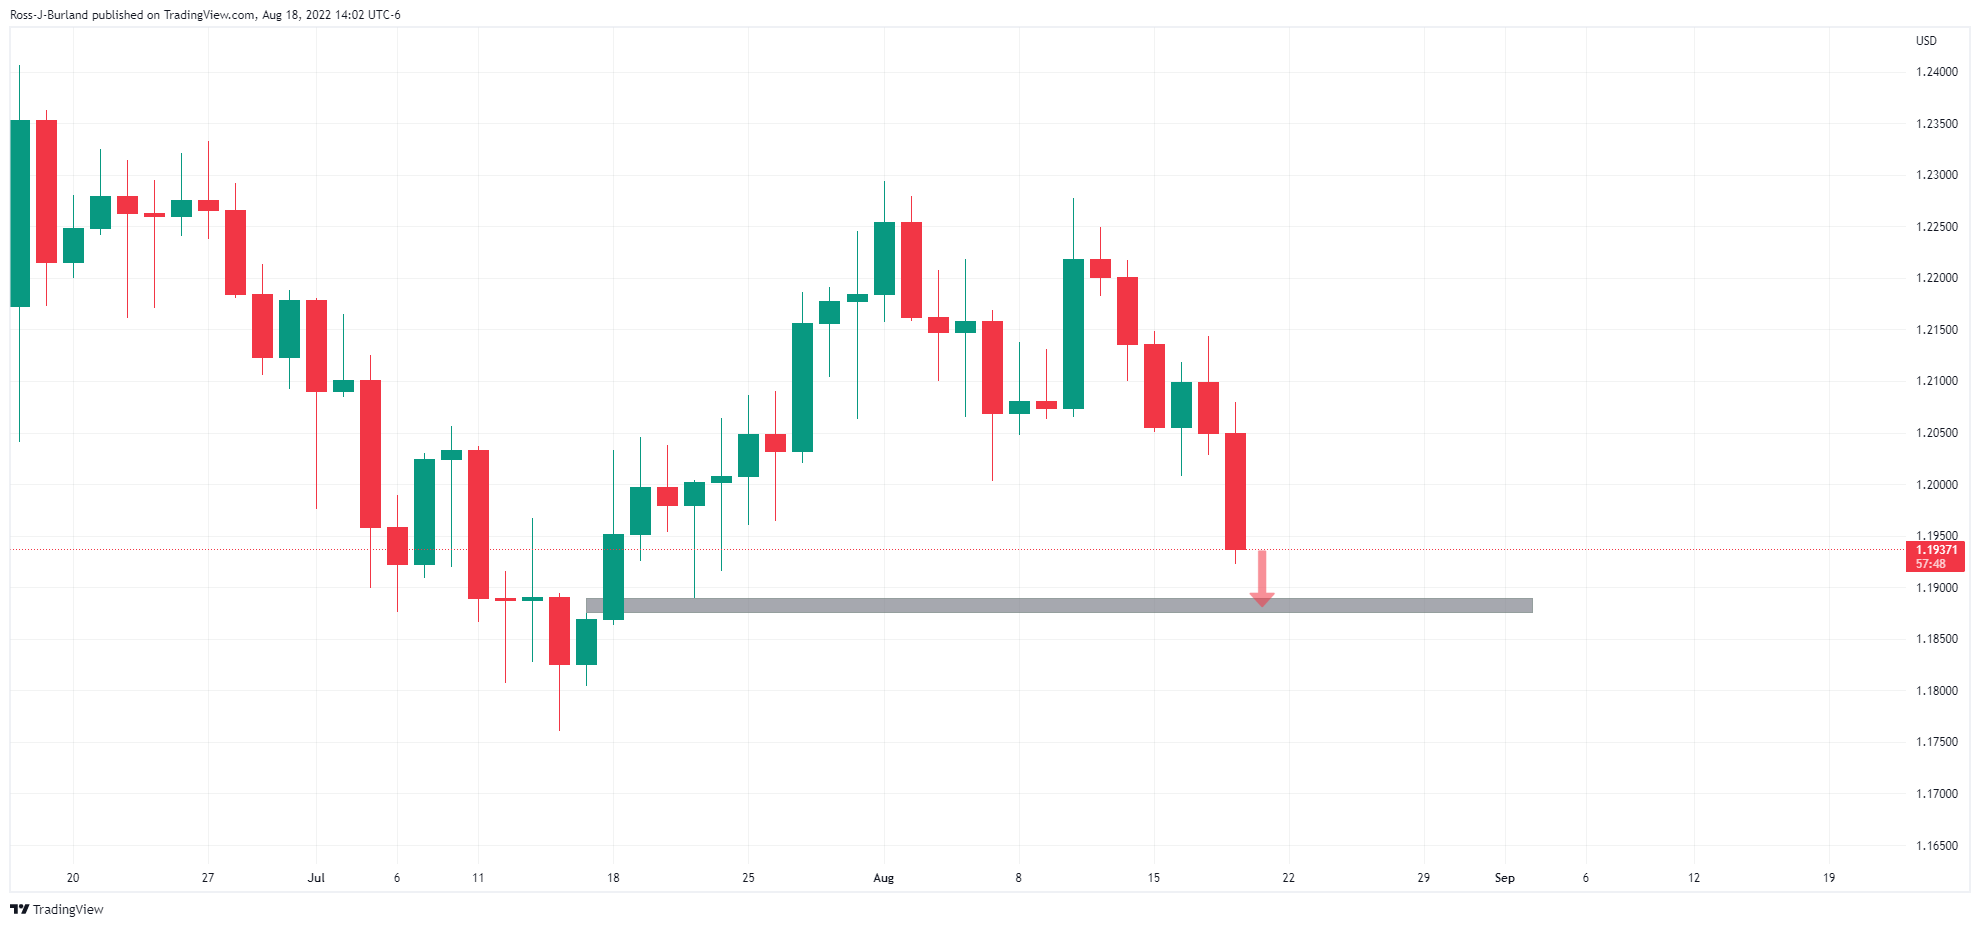
The bears could be on the verge of mitigation of the price imbalance between 1.1875 and 1.1889 which makes buying the dip on the lower time frames like trying to catch a falling knife.
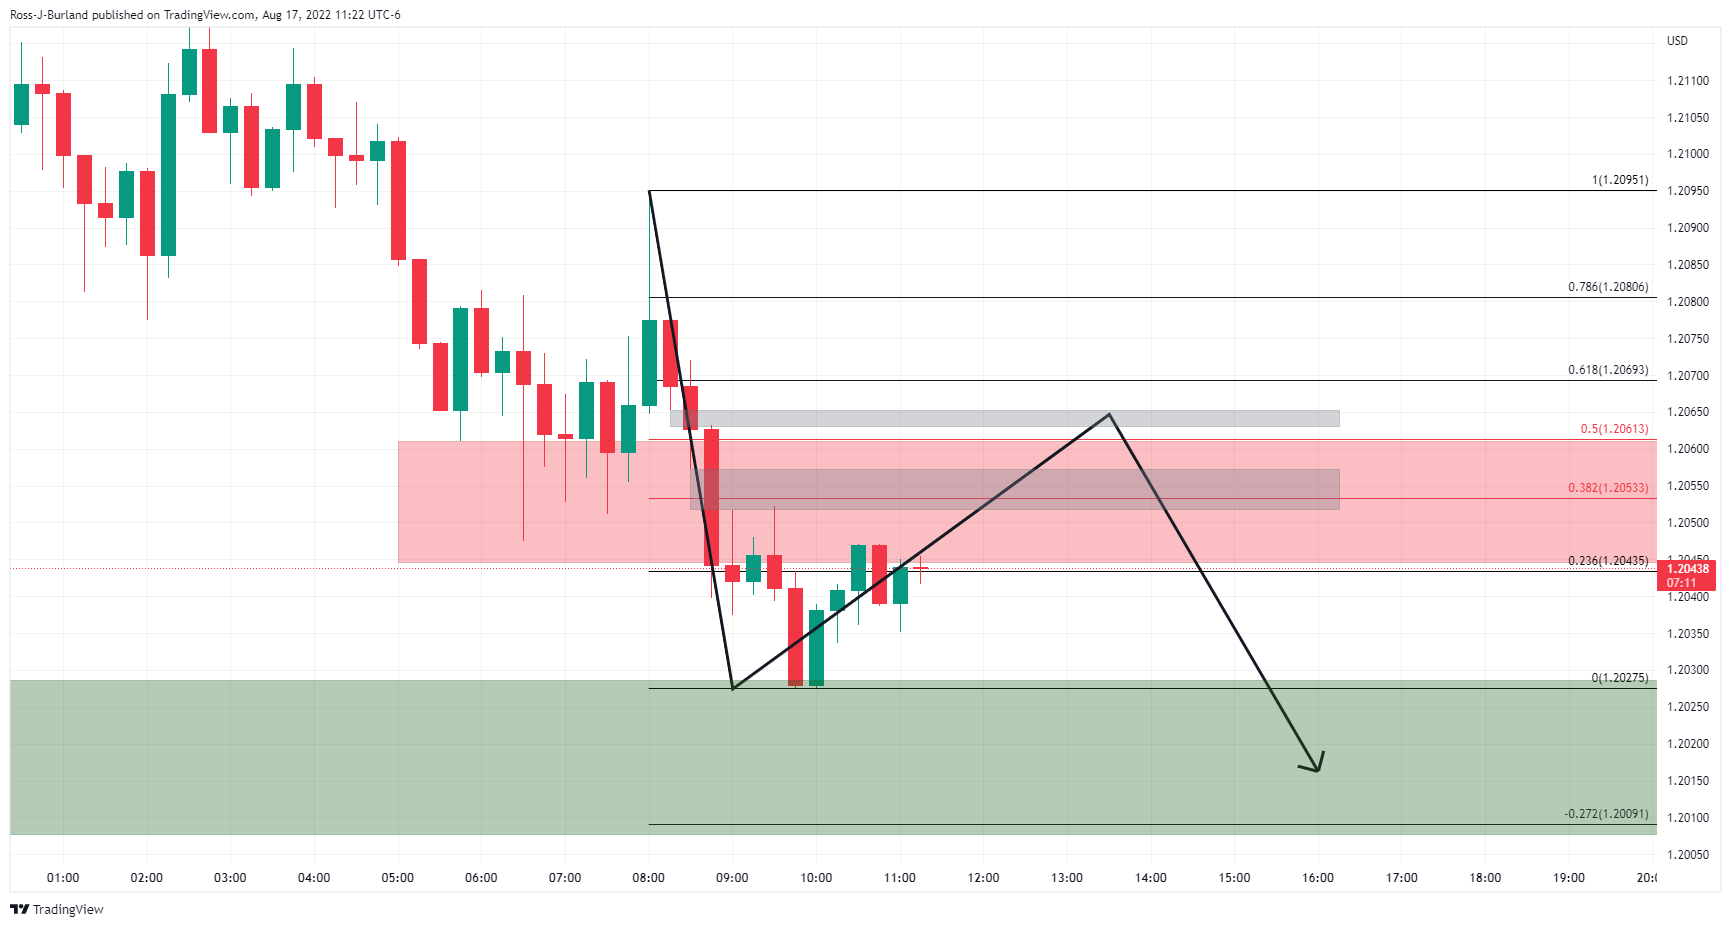
Nevertheless, should the minuite charts offer a bullish structure and opportunity, it could look something like as follows:
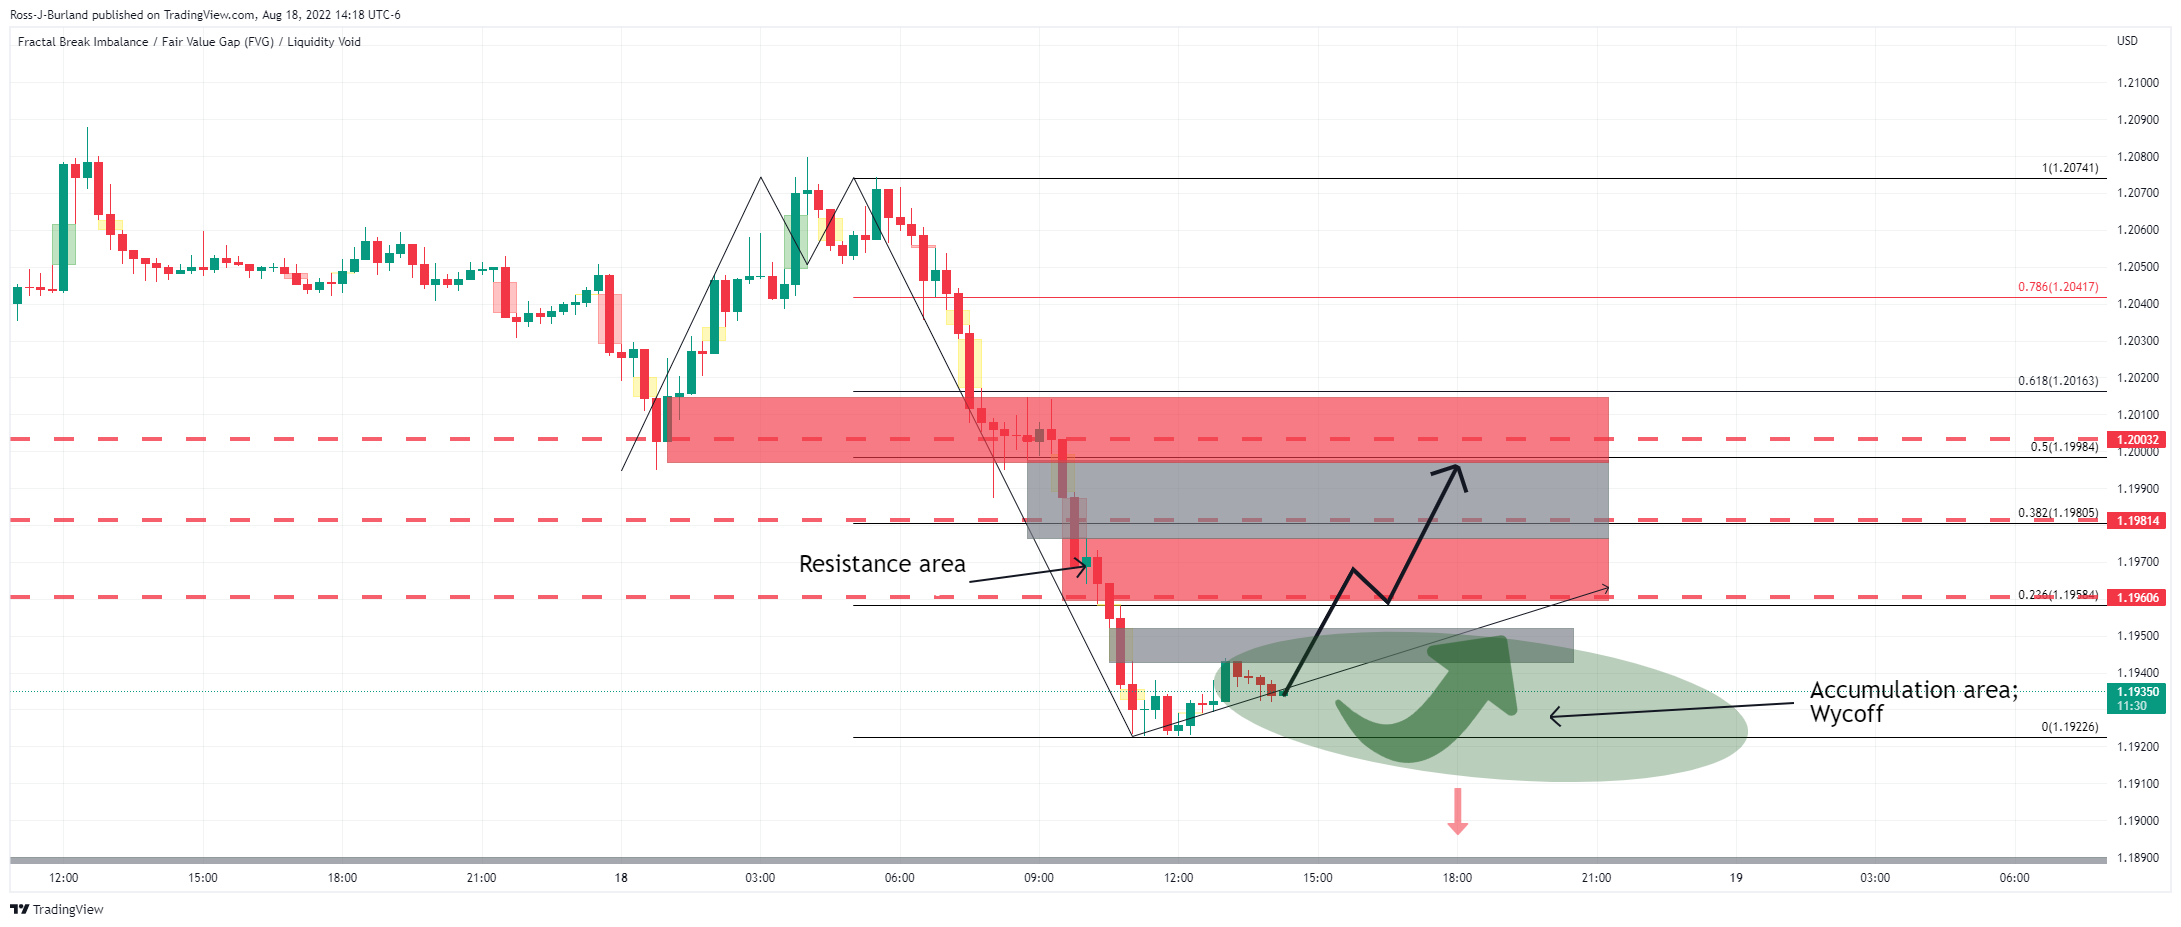
The hourly charts Fibonacci retracement scale aligns with prior structure areas as illustrated above and below, zoomed in:
The M-formation is a reversion pattern, and the price would be expected to correct higher now that we have seen a deceleration of the supply. This gives rise to an opportunity to buy into the correction on lower time frames:
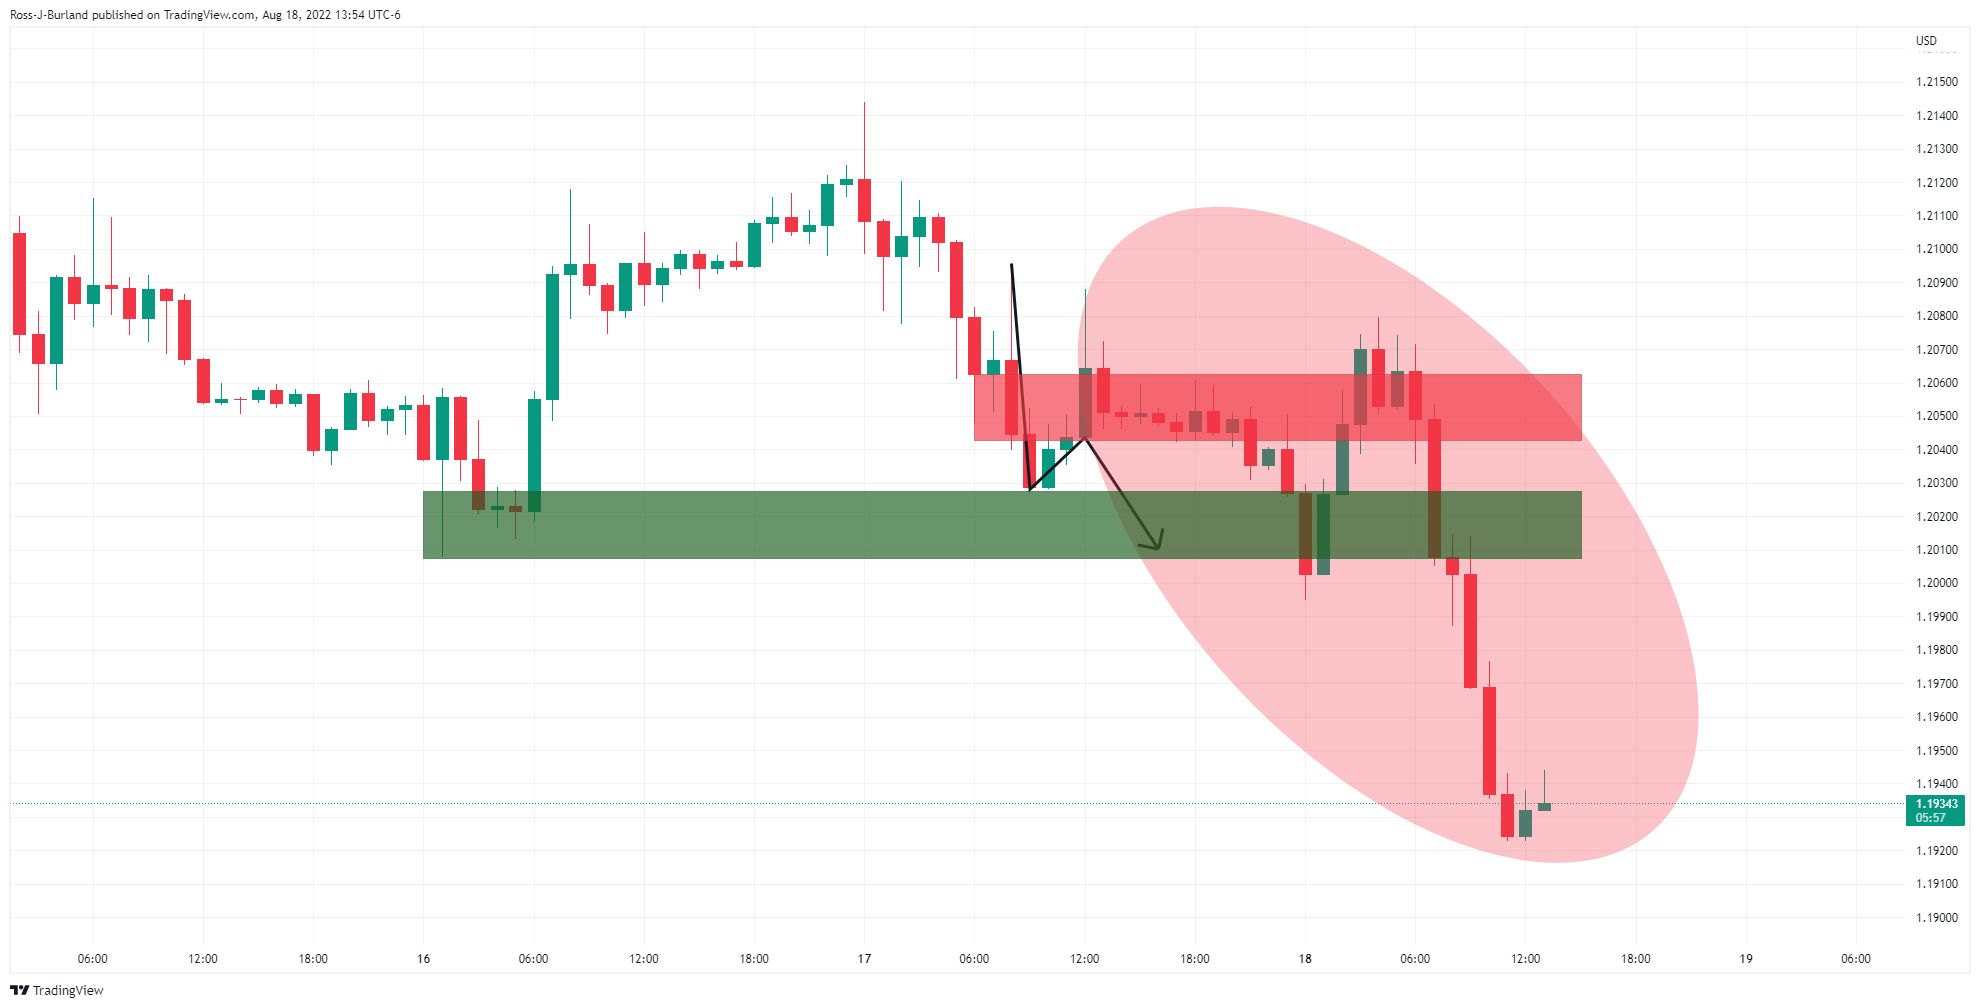
GBP/USD 15 & 5-min charts
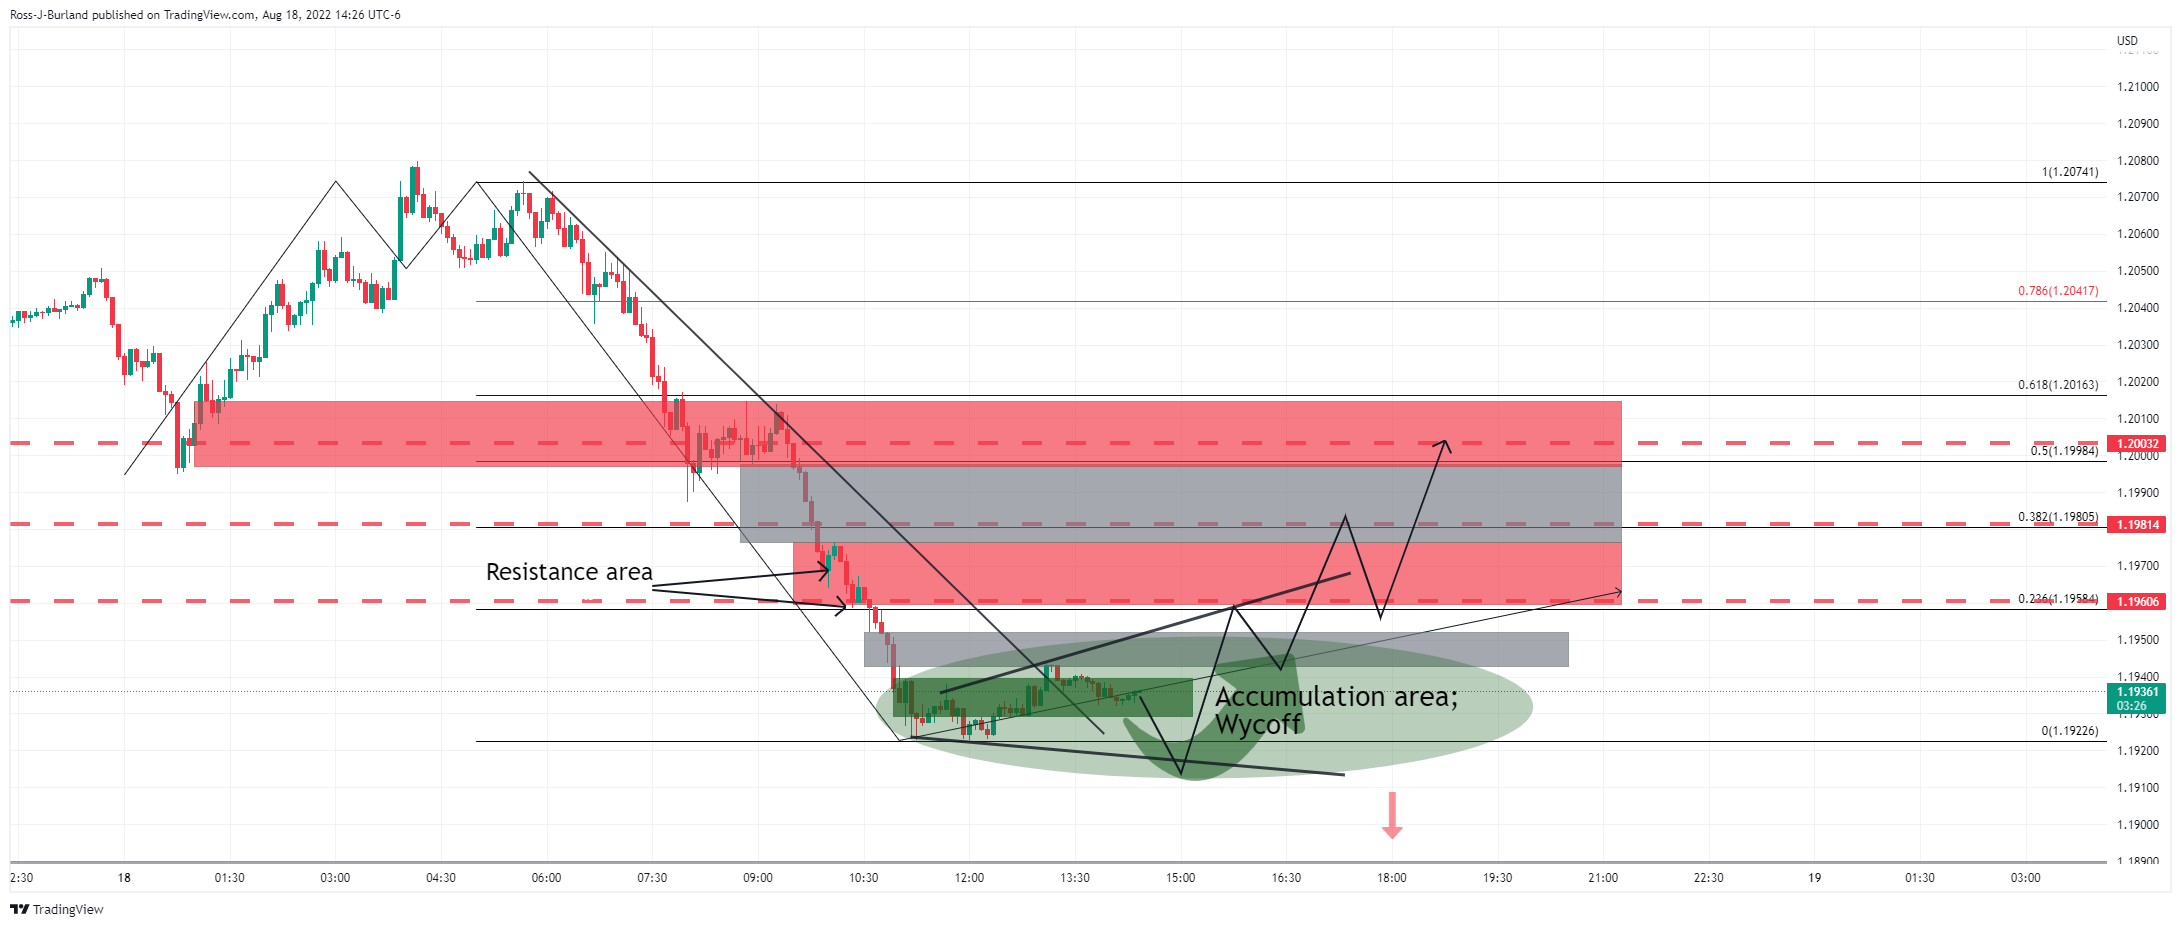
As illustrated, the price is in a phase of accumulation, moving out of the resistance trendline. Should the bulls stay in charge, then the above scenarios could play out in either an imminent breakout of the structure higher or a protracted phase of price discovery allowing for a dip lower and some sideways price action within a broadening formation and range.