- EUR/USD Price Analysis: Will the pair reach parity ahead of the weekend?
Notícias do Mercado
EUR/USD Price Analysis: Will the pair reach parity ahead of the weekend?
- The EUR/USD breached the 1.0100 mark; a daily close below 1.0096 paves the way towards parity.
- In the near term, the EUR/USD could print a leg-up towards 1.0120-30, before re-testing parity.
The EUR/USD slides below the 1.0100 figure for the first time since July 27, as EUR sellers eye a daily close below 1.0096, which could pave the way for a re-test of the pair’s parity. At the time of writing, the EUR/USD is trading at 1.0089, well below its opening price, after reaching a daily high of 1.0184.
EUR/USD Price Analysis: Technical outlook
Since the beginning of the week, the EUR/USD began its free fall, from around 1.0268, exacerbated by the release of important US economic data. That, alongside the release of the FOMC minutes, were the reasons for initial EUR weakness. Nevertheless, buyers hold the fort around 1.0100 before giving way to EUR/USD sellers.
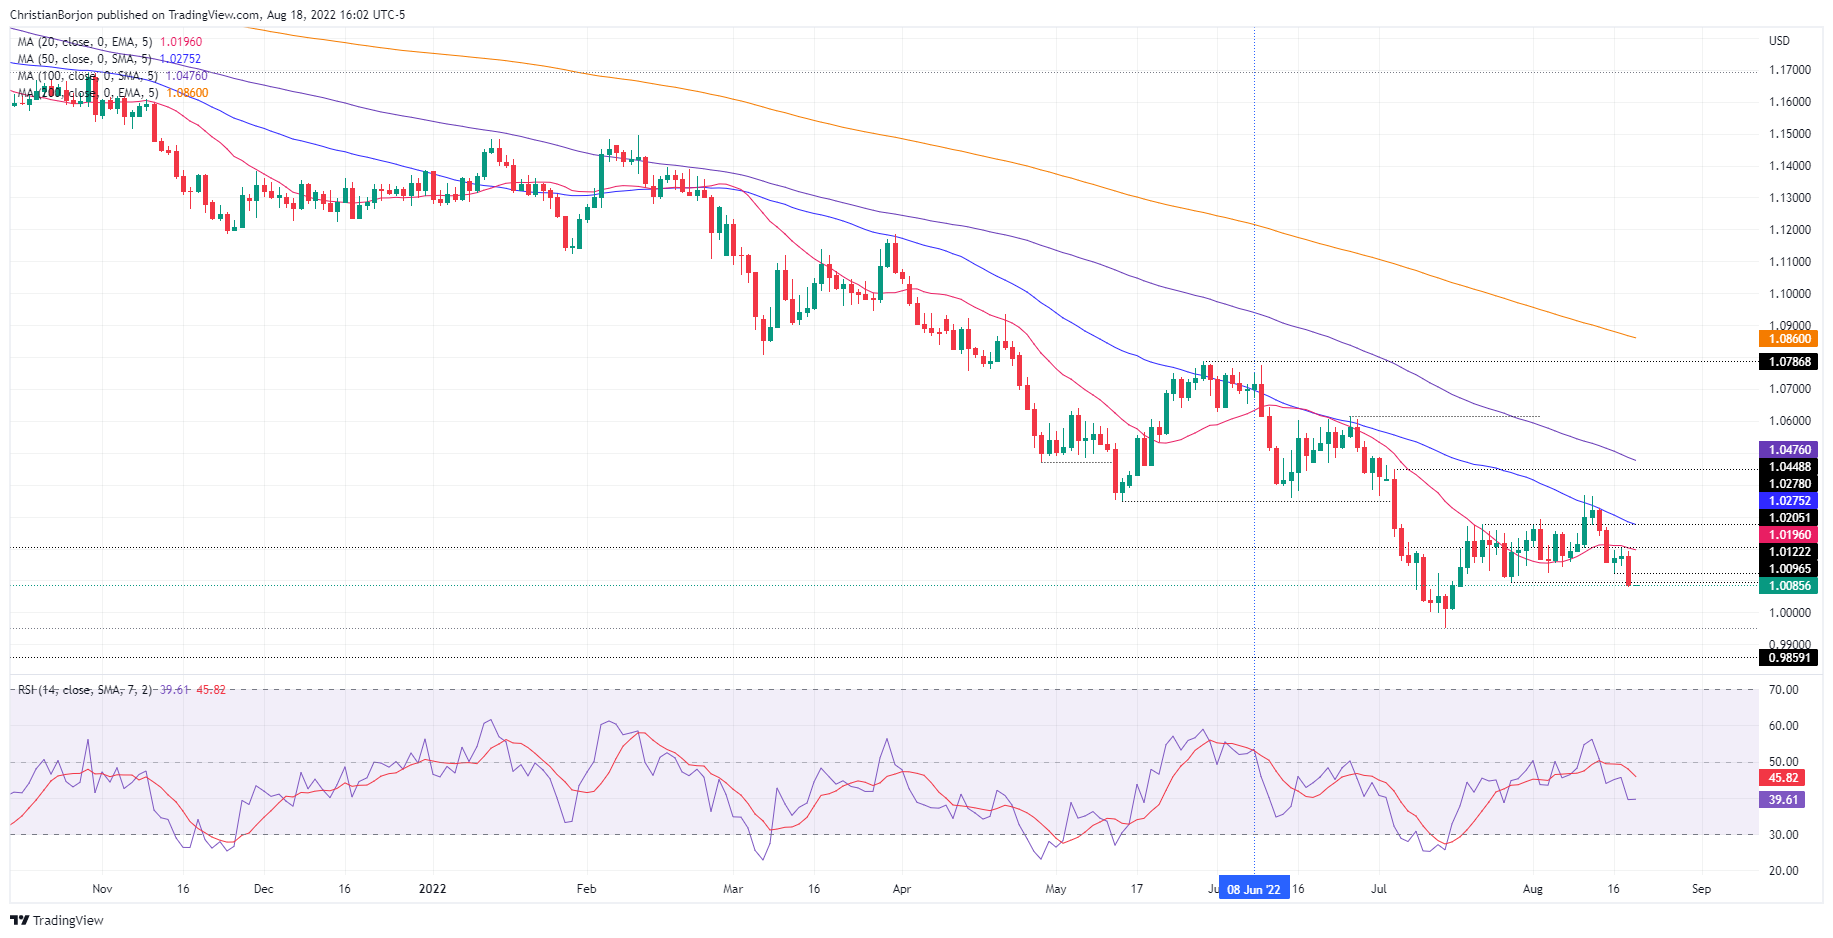
On Thursday, the EUR/USD broke below the July 27 daily low at 1.0096, positioning sellers before launching an assault towards parity. The Relative Strength Index (RSI) at 39.65, pointing downwards, provides enough room for sellers before reaching oversold conditions.
Therefore, the EUR/USD’s next support would be July’s 8 daily low at 1.0078. Once cleared, there’s nothing in the way for a re-test of 1.0000, followed by the YTD low at 0.9952.
 EUR/USD Daily chart
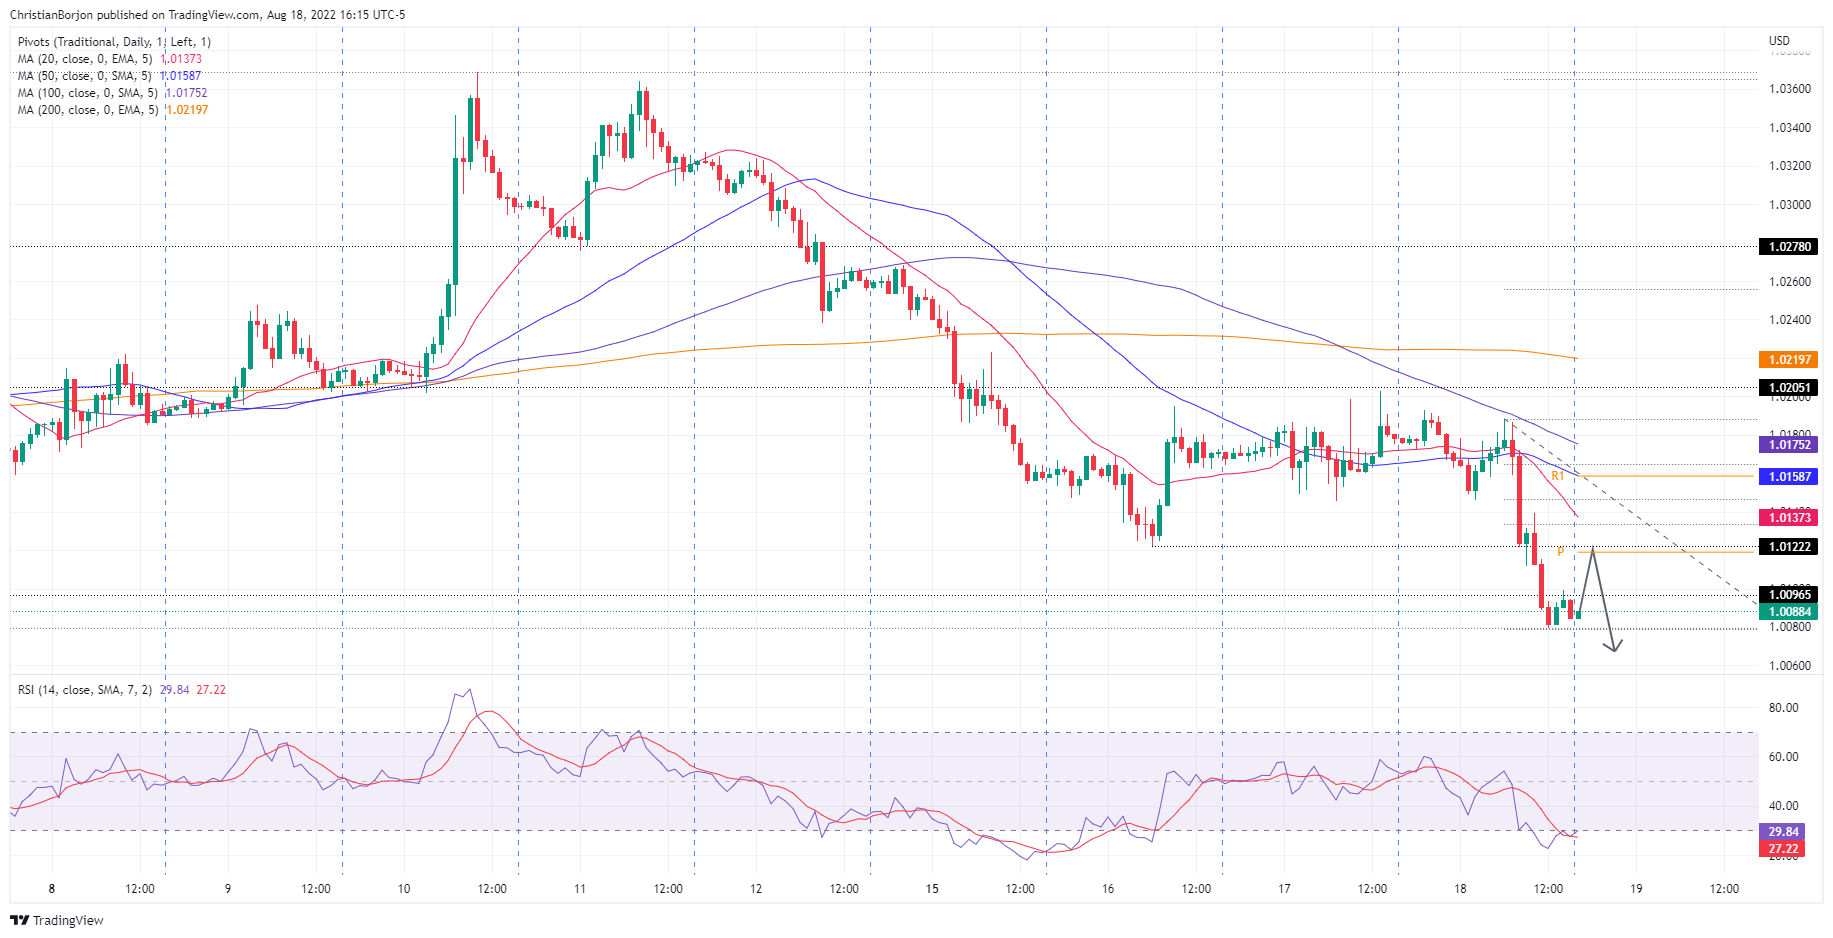
In the one-hour scale, the EUR/USD is also downward biased, but the Relative Strength Index (RSI) at oversold territory might suggest the pair can print a leg-up before resuming the downtrend. If the EUR/USD jumps above the 1.0099 intraday swing high, that could exacerbate a move towards August’s 16 low at 1.0122 or to the 50% Fibonacci retracement at 1.0133. Once that’s said and done, a fall towards 1.0000 is on the cards.

EUR/USD Hourly chart
EUR/USD Key Technical Levels