- EUR/USD Price Analysis: Bulls eye a deeper bullish correction for the days ahead
Notícias do Mercado
EUR/USD Price Analysis: Bulls eye a deeper bullish correction for the days ahead
- EUR/USD bulls tiring and the bears are moving in in the near term.
- Longer-term, there are prospects of a bullish continuation in this daily correction for the days ahead.
EUR/USD has rallied on the day and is now consolidating in a correction of the bullish im[pulse. The following illustrates the potential flight trajectory based upon multi-time frame price action and structure between the daily, 4 and 1-hour charts, down to the 15-minute chart.
EUR/USD daily chart
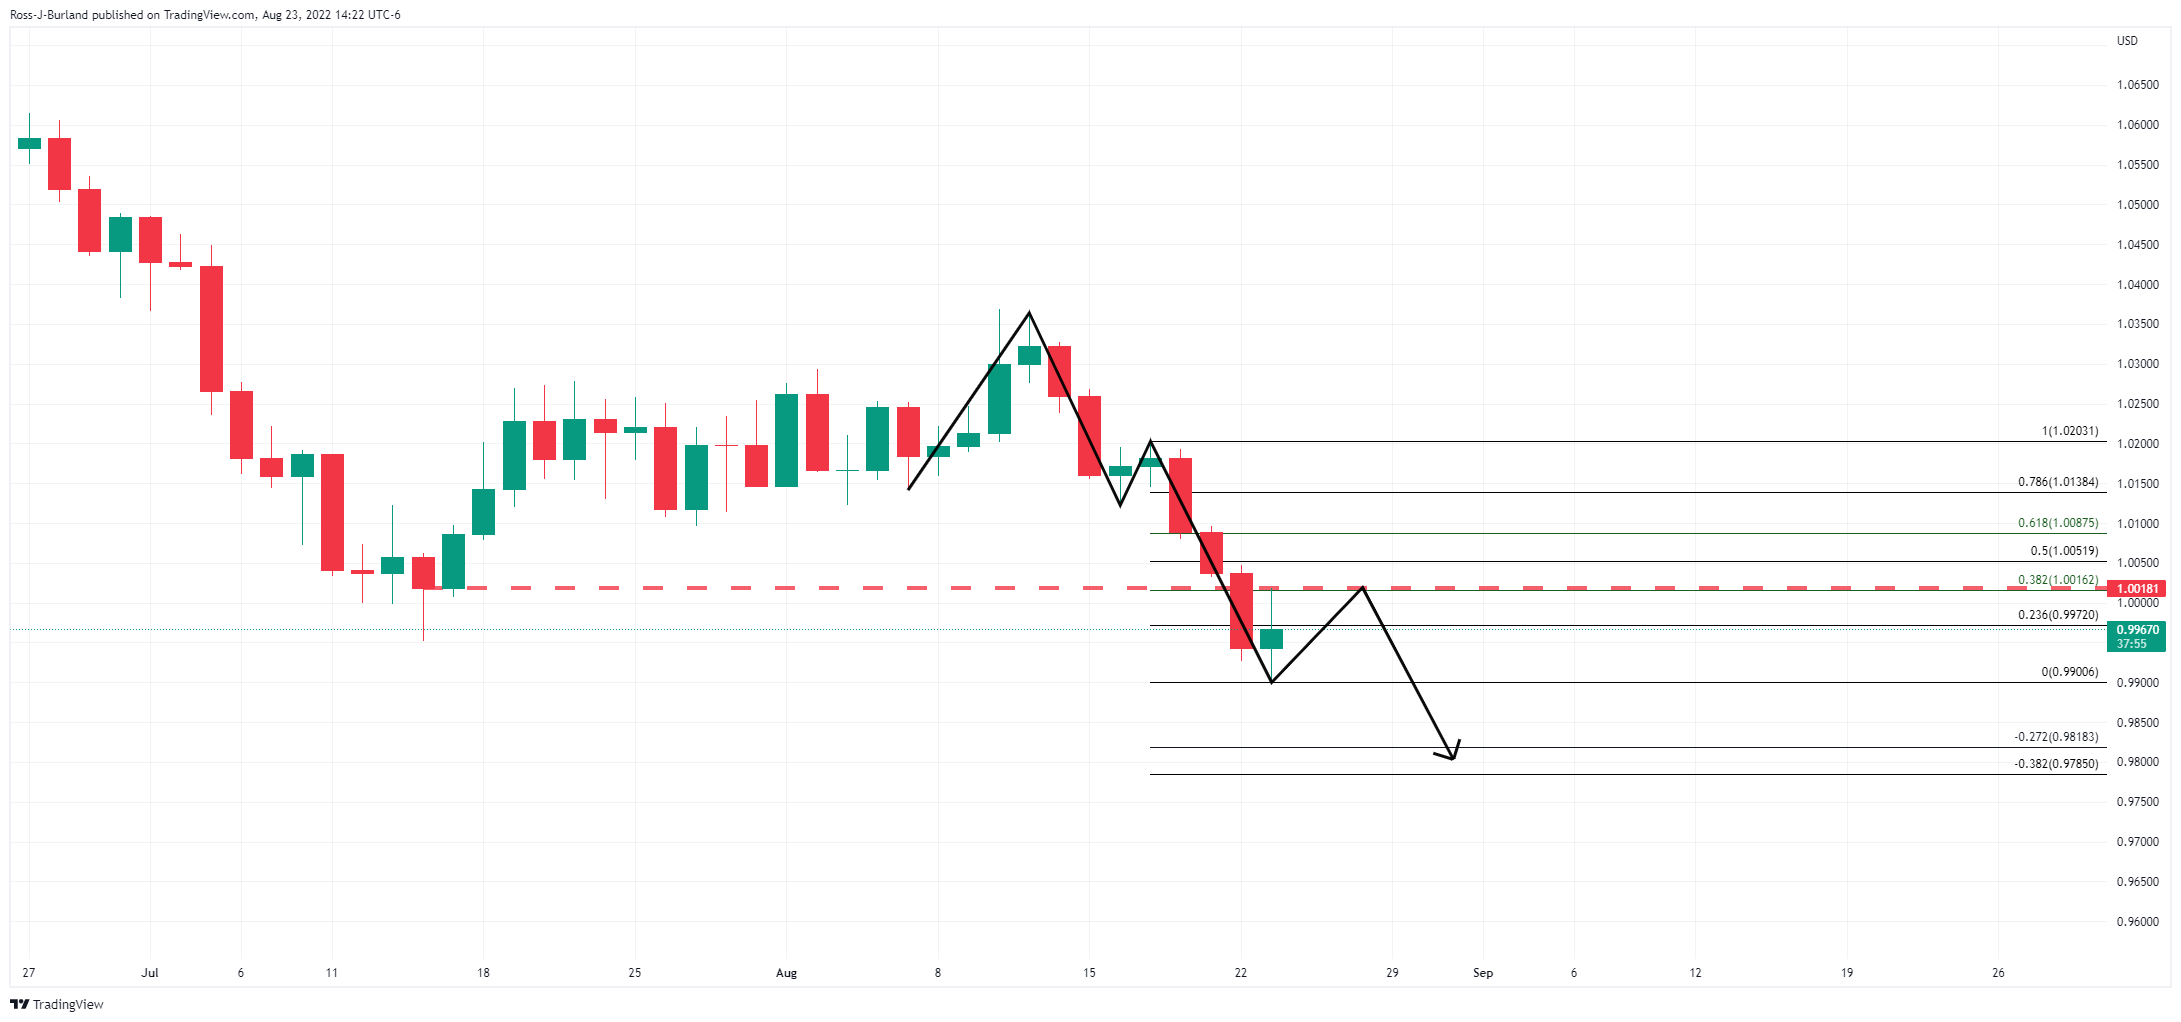
The M-formation is a reversion pattern on the daily chart that has seen the price pull into the 38.2% Fibonacci. It would be unusual for the price to continue lower from here without at least another bar or two of corrective activity that could see the price move higher in the days ahead before the next sell-off.
H4 chart

Meanwhile, with the price forming a W-formation on the 4-hour chart, there would appear to be some prospect of a deeper correction of the current bullish impulse.
EUR/USD H1 chart
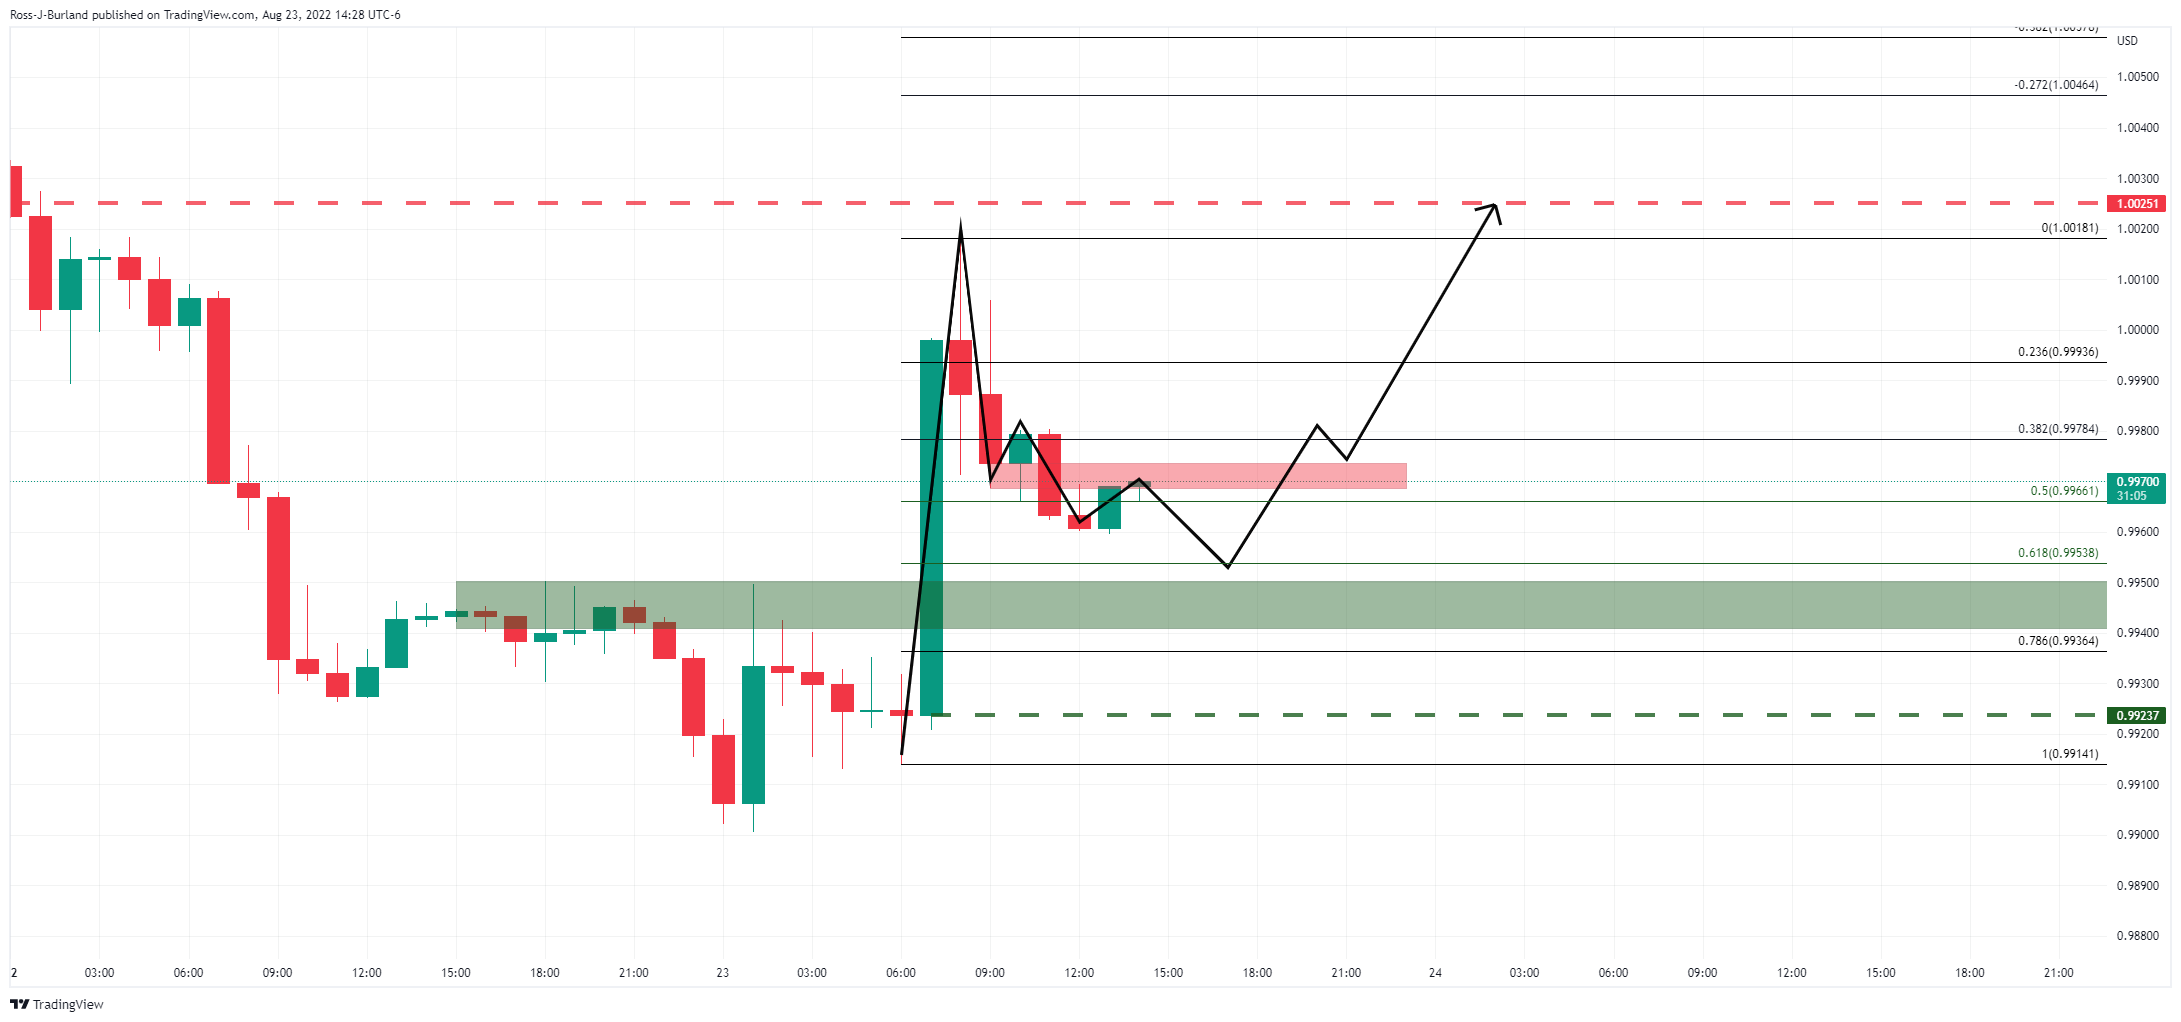
The hourly chart sees the price formation an M-formation and should the neckline hold as resistance, then the price will likely follow the 4-hour bearish bias for the session ahead.
EUR/USD M15 chart

With that being said, there would appear to be the possibility of a break higher in the very short term considering the inverse head and shoulders on the 15-min chart.