- GBP/USD Price Analysis: Retreats towards 1.1800 inside weekly bearish channel
Notícias do Mercado
GBP/USD Price Analysis: Retreats towards 1.1800 inside weekly bearish channel
- GBP/USD pares the week-start rebound from multi-month low.
- Bearish chart pattern, key SMAs challenge buyers even as RSI, MACD favor further recovery.
- The longer-term falling channel adds barriers to the trading filters.
GBP/USD rebound fails to gain acceptance inside a one-week-old descending trend channel. That said, the cable pair seesaws around the resistance line of the stated bearish chart pattern, close to 1.1835 during the initial Asian session on Wednesday.
In addition to the aforementioned channel’s top, near 1.1855, the 100-HMA and the 200-HMA could also challenge GBP/USD bulls around 1.1870 and 1.1990 in that order.
GBP/USD: Hourly chart
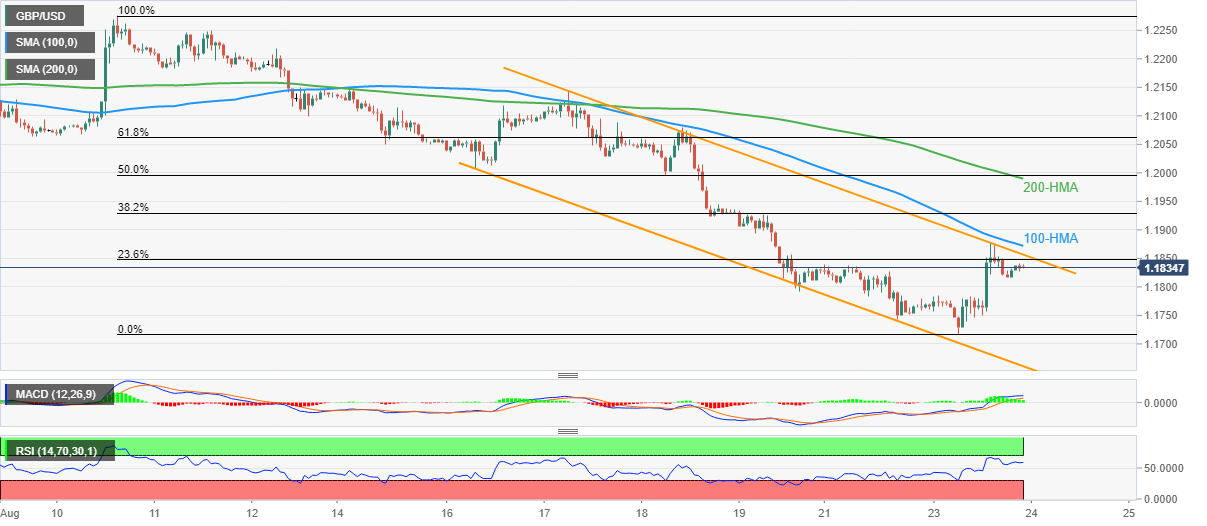
Trend: Further weakness expected
Following that, the 1.2000 psychological magnet and convergence of the 21-DMA and the 50-DMA on the daily chart will be crucial for the pair buyers to watch.
Above all, the upper line of the downward sloping trend channel from mid-May, close to 1.2200, appears the last defense of the GBP/USD sellers.
GBP/USD: Daily chart
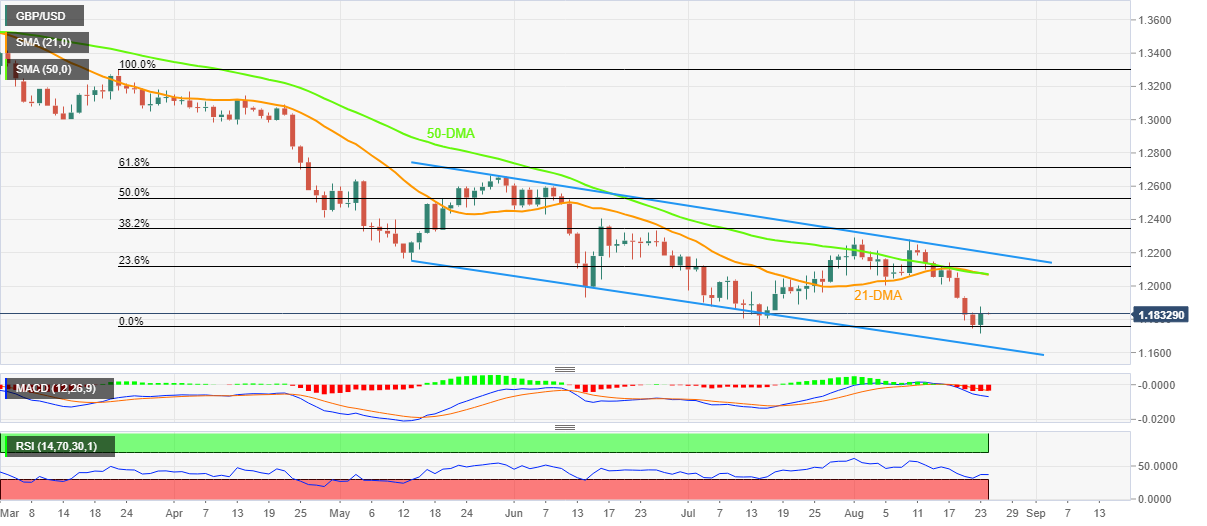
Trend: Bearish
It’s worth noting that the MACD and RSI are both suggesting short-term recovery on the hourly chart.
Alternatively, the 1.1790 level acts as the immediate support ahead of the latest lows near 1.1720-15.
Following that, the weekly channel’s support line and the lower line of the longer-term trend channel, respectively near 1.1660 and 1.1615, will be crucial supports to watch during the GBP/USD pair’s further weakness.