- USD/CHF Price Analysis: Subdued around 0.9635, despite forming a bearish-harami candle pattern
Notícias do Mercado
USD/CHF Price Analysis: Subdued around 0.9635, despite forming a bearish-harami candle pattern
- USD/CHF exchanges hands under its opening price, despite recovering from daily lows.
- The USD/CHF is range-bound through a break of the top of the range will pave the way above the 0.9700 figure; otherwise, a fall towards 0.9550 is on the cards.
The USD/CHF drops into negative territory after refreshing five-week highs around 0.9650s, courtesy of broad US dollar weakness across the board, amidst an upbeat market mood. After hitting a daily high at 0.9626, the USD/CHF dived below the 50-day EMA at 0.9612, the day’s lows, before jumping to current price levels. At the time of writing, the USD/CHF trades at 0.9645, below its opening price.
USD/CHF Price Analysis: Technical outlook
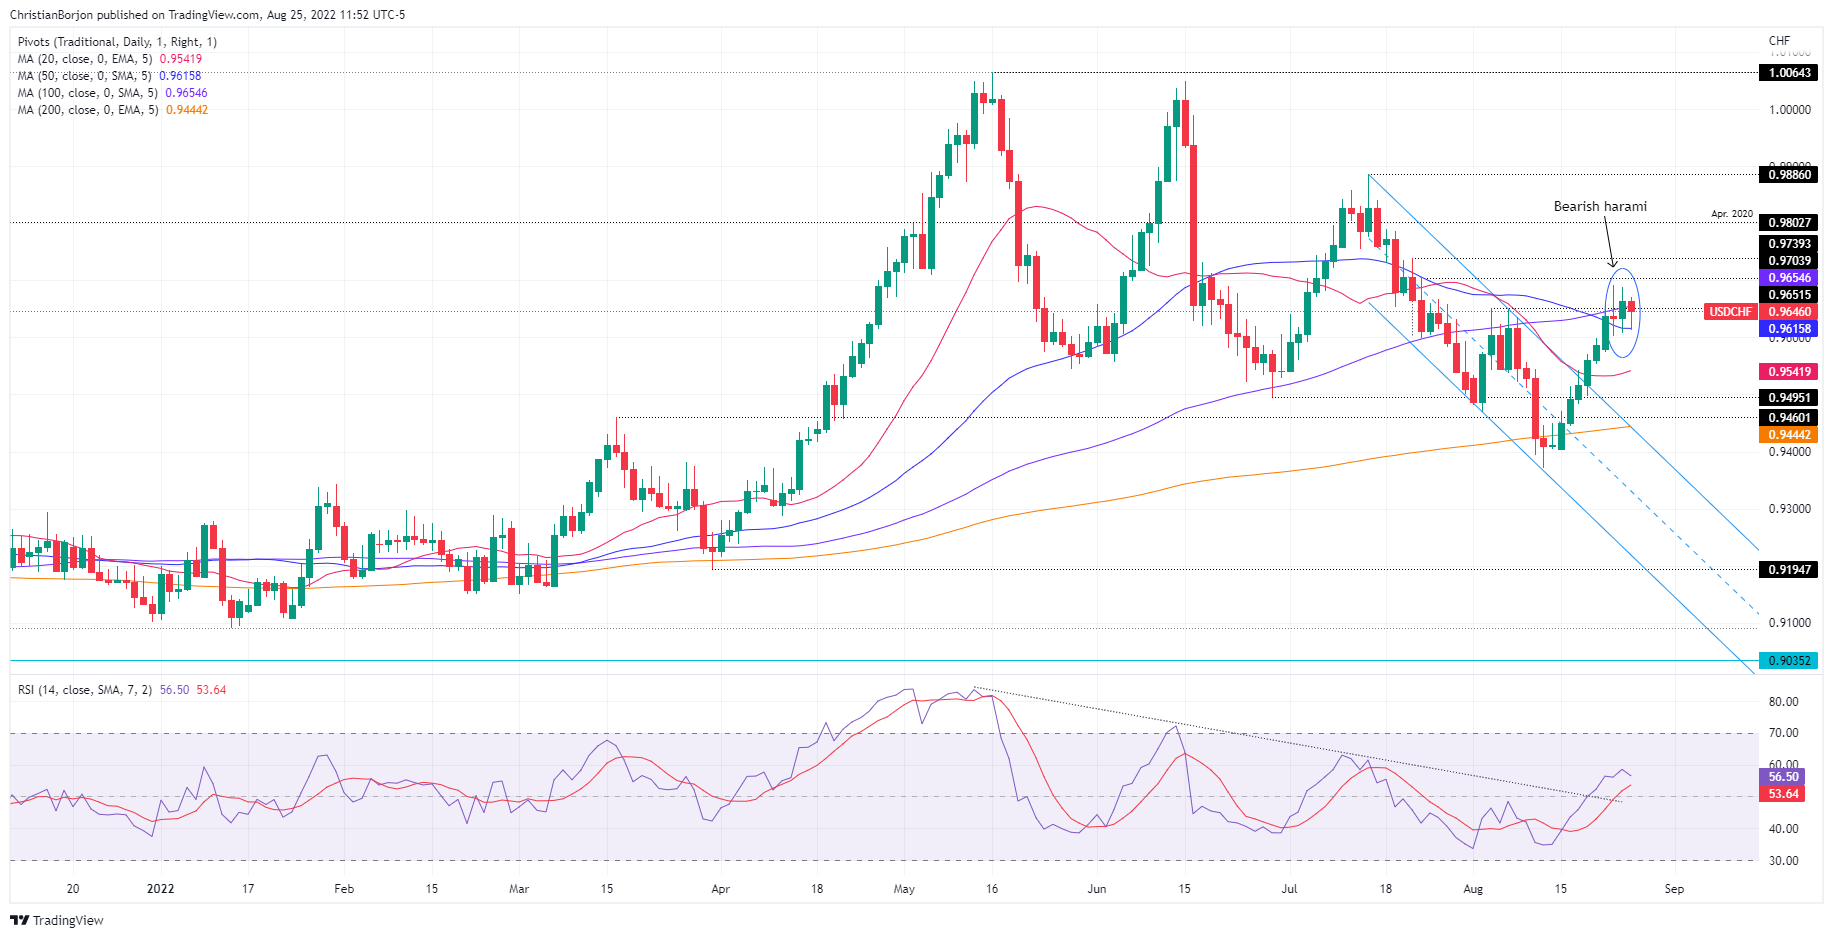
A bearish-harami candle chart pattern emerged in the USD/CHF daily chart. Even though the pattern has bearish implications, oscillators and moving averages (MAs) portray the opposite. Albeit the RSI has a downslope, it remains in positive territory. Meanwhile, all the daily Exponential Moving Averages are below the USD/CHF spot price, suggesting that buyers are in charge.

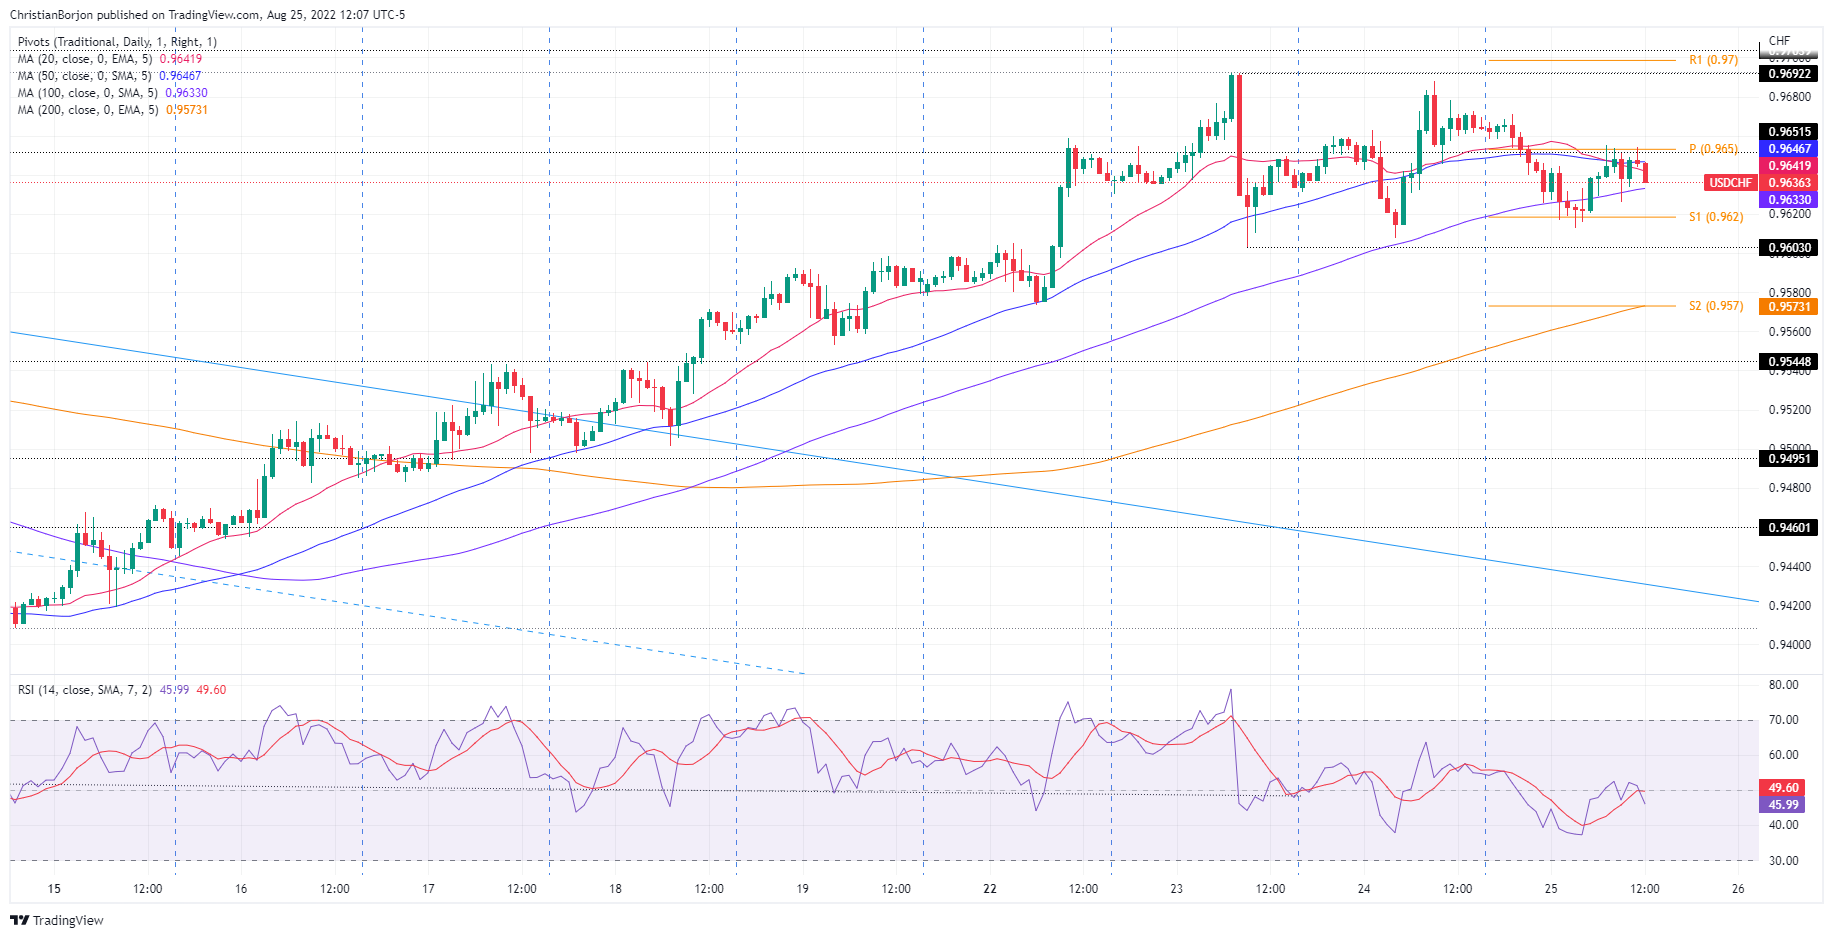
In the near term, the USD/CHF one-hour chart depicts the pair as range-bound within the 0.9603-0.9692 area for the last three days. Further confirmation of the previously mentioned is that the 20, 50, and 100 exponential moving averages (EMAs), are located within the 0.9632-46 area. Also, the Relative Strength Index (RSI) at 52 is almost flat.
Therefore, if the USD/CHF breaks above the range, the first resistance would be the 0.9700 figure. Once cleared, the next resistance would be the R2 daily pivot at 0.9733, followed by 0.9800. On the flip side, the USD/CHF first support would be the 0.9600 mark, followed by the confluence of the 200-EMA and the S2 pivot at 0.9570, and then the August 19 daily low at 0.9553.

USD/CHF Key Technical