- EUR/JPY Price Analysis: Rallies and threatens to negate a head-and-shoulders on the daily chart
Notícias do Mercado
EUR/JPY Price Analysis: Rallies and threatens to negate a head-and-shoulders on the daily chart
- EUR/JPY advanced sharply towards the 139.00 figure, though retraced some, as the 50-day EMA emerged as resistance.
- Expect consolidation in the near term, as the EUR/JPY 4-hour chart RSI’s is overbought.
The EUR/JPY rallies to fresh six-week highs around 138.97 during the North American session on Monday. As the Asian Pacific session begins, the EUR/JPY is trading at 138.72, so far invalidating a head-and-shoulders chart pattern in the daily chart.
EUR/JPY Price Analysis: Technical outlook
The EUR/JPY faced solid resistance at the 50-day EMA around 138.86 after reaching 139.00 on Monday. Worth noting that if the EUR/JPY breaks above the July 21 high at 143.32, it will invalidate the chart pattern, paving the way for further gains.
The EUR/JPY resistance levels lie at the 50-day EMA, followed by 139.00 and 140.00 psychological levels. On the flip side, the EUR/JPY first support would be the 100-day EMA at 138.28, followed by the 138.00 figure, followed by the 20-day EMA at 137.00.
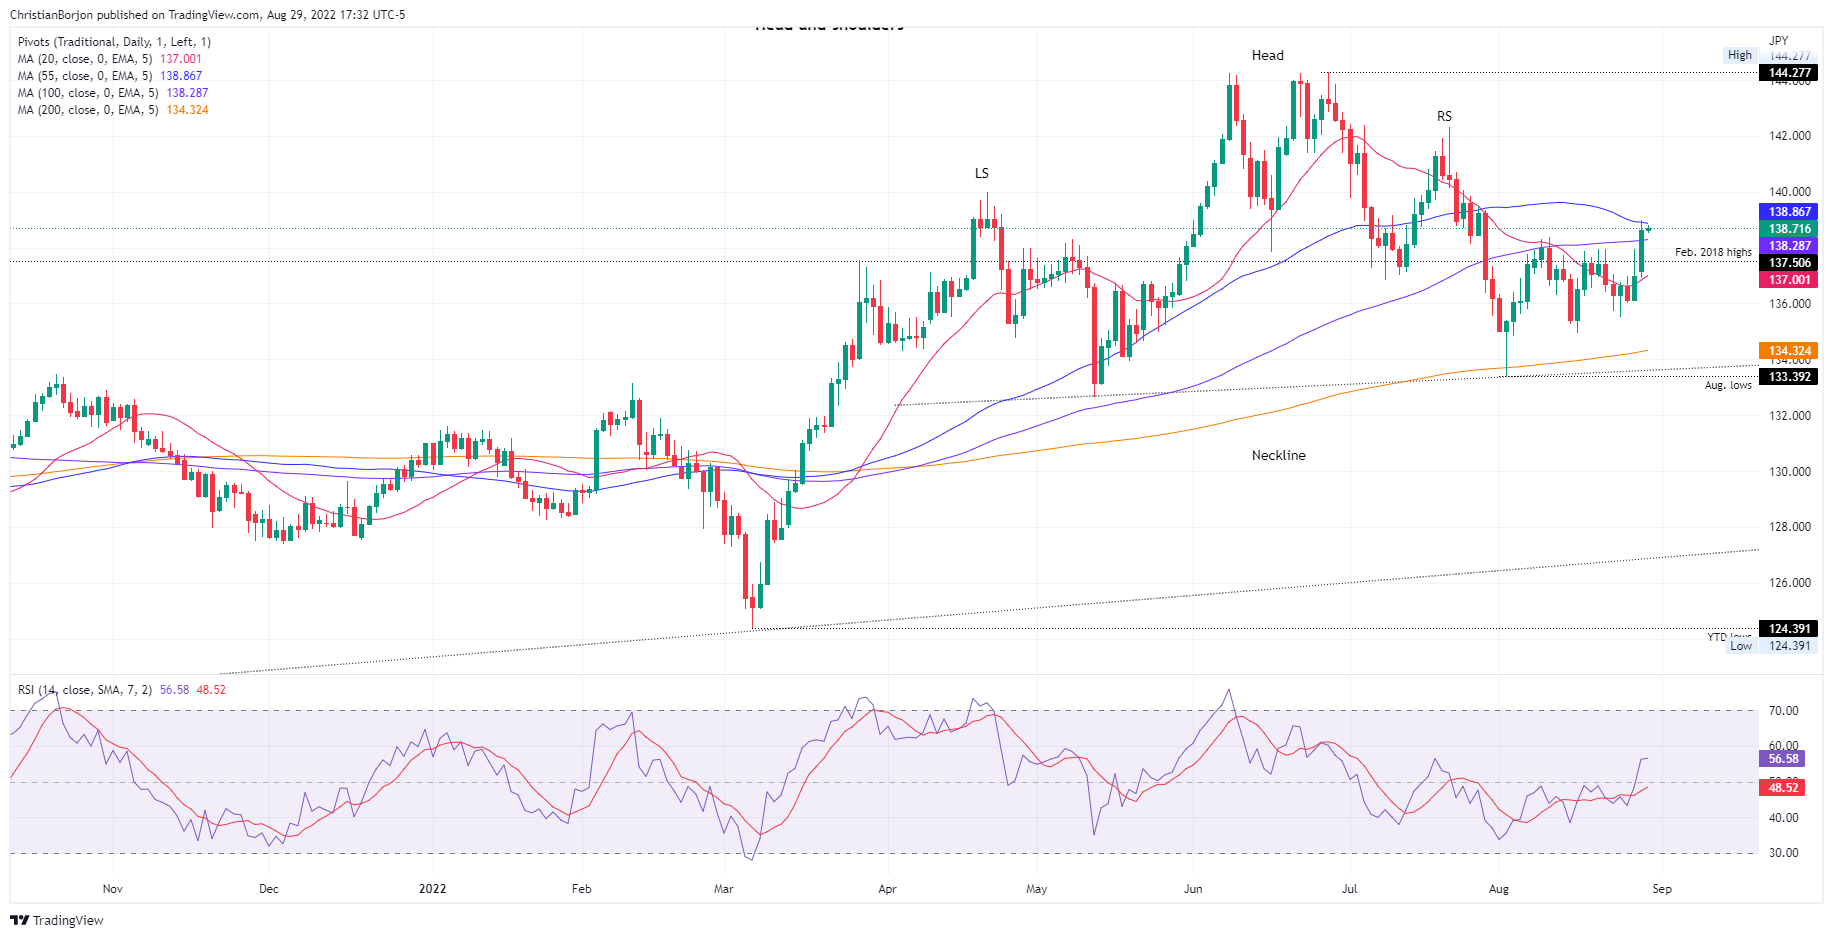
EUR/JPY Daily chart
The EUR/JPY 4-hour chart illustrates the par breaking above the August 10 high at 138.39, opening the door to further gains. However, the Relative Strength Index (RSI) is in overbought territory, meaning the cross-currency could consolidate before resuming upwards.
On its way north, a break above 139.00 will expose the confluence of the July 27 high and the R1 daily pivot around 137,50, followed by the July 25 daily high at 140.07, ahead of the R2 pivot point.
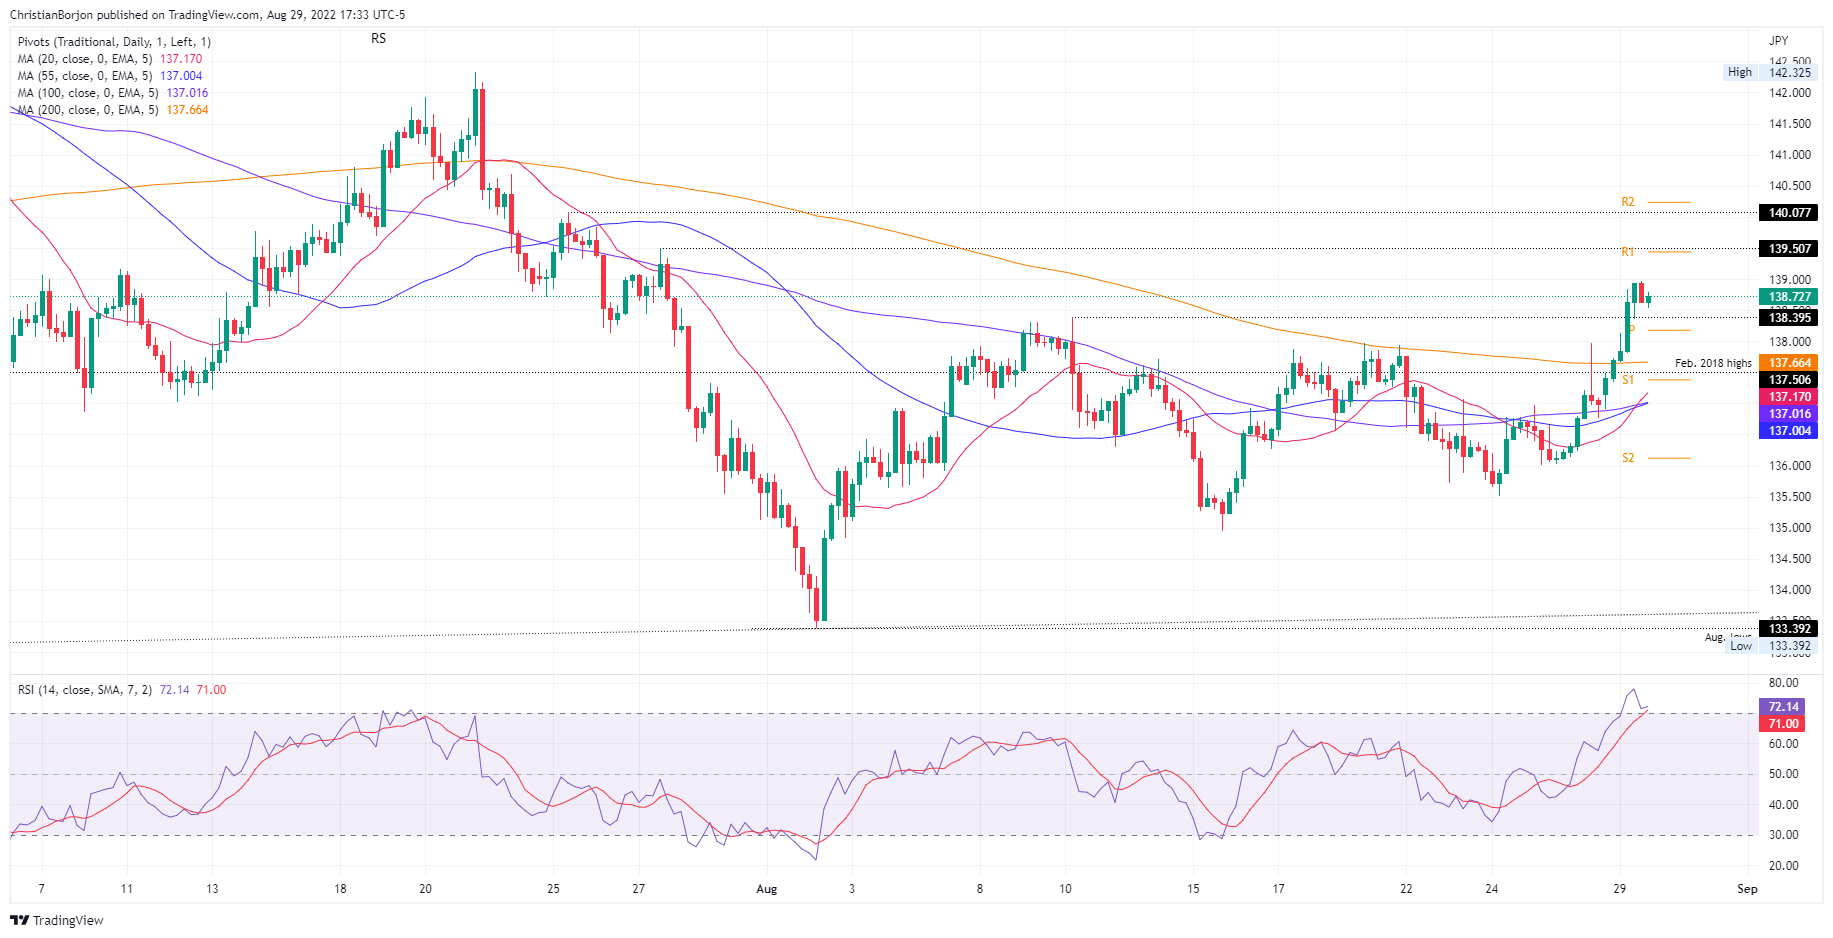
EUR/JPY 4-hour chart
EUR/JPY Key Technical Levels