- Gold Price Forecast: XAU/USD bears target $1,688 ahead of key US data – Confluence Detector
Notícias do Mercado
Gold Price Forecast: XAU/USD bears target $1,688 ahead of key US data – Confluence Detector
- Gold price licks its wounds near monthly lows after testing the $1,700 mark.
- US dollar rallies with yields as investors cheer hawkish Fed and ECB rate hike bets.
- XAU/USD could extend losses towards $1,688 on a firm break below $1,700.
Gold price is on a five-day downtrend, eyeing a sustained move below the $1,700 mark amid unrelenting buying interest seen around the US dollar. Markets seem to be convinced about a 75 bps Fed rate hike in September, reflective of the ongoing rally in the US Treasury yields across the curve. The two-year US rates are at their highest level since 2007 while the benchmark 10-year yields are at two-month highs above 3.20%. According to CME FedWatch Tool, there is a 72% probability of an outsized rate hike this month. Further, Eurozone inflation hit another record high at 9.1% in August, cementing a 75 bps Sept ECB rate hike. Expectations of aggressive tightening from the Fed and the ECB offset weak US ADP jobs data, weighing negatively on the non-yielding bullion. The bright metal now looks forward to the US ISM Manufacturing PMI and Nonfarm Payrolls data for fresh trading directives.
Also read: Gold Price Forecast: XAUUSD close to confirming a long-term double top
Gold Price: Key levels to watch
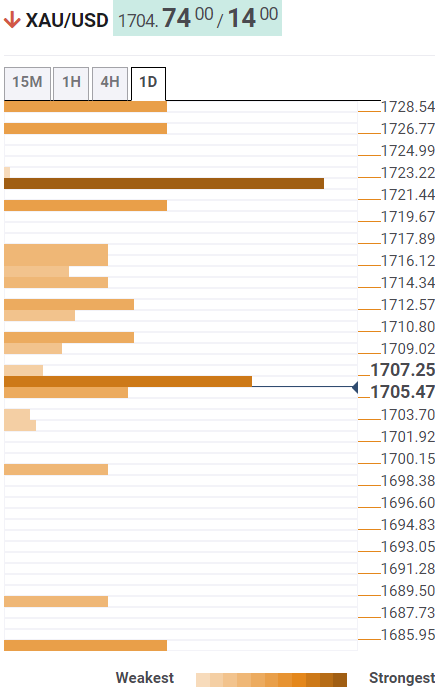
The Technical Confluence Detector shows that the gold price is gathering strength for the next push lower, as bears aim for the pivot point one-day S2 at $1,700.
If sellers find a strong foothold below the latter, a sharp sell-off towards the pivot point one-day S3 at $1,688 will be inevitable.
On the flip side, any recovery attempts will need acceptance above the convergence of the pivot point one-week S2 and the previous low four-hour at $1,707.
The previous day’s low of $1,710 will challenge the road to recovery, above which the Bollinger Band one-day Lower at $1,713 will come into play.
Further up, a dense cluster of resistance levels around $1,716 will be a tough nut to crack for bulls. That price zone is the confluence of the Fibonacci 38.2% one-day and SMA5 four-hour.
Here is how it looks on the tool
About Technical Confluences Detector
The TCD (Technical Confluences Detector) is a tool to locate and point out those price levels where there is a congestion of indicators, moving averages, Fibonacci levels, Pivot Points, etc. If you are a short-term trader, you will find entry points for counter-trend strategies and hunt a few points at a time. If you are a medium-to-long-term trader, this tool will allow you to know in advance the price levels where a medium-to-long-term trend may stop and rest, where to unwind positions, or where to increase your position size.