- USD/CAD Price Analysis: Bears move in for the kill at key hourly structure
Notícias do Mercado
USD/CAD Price Analysis: Bears move in for the kill at key hourly structure
- USD/CAD bears are moving in for a test below key hourly structure.
- The weekly W-formation could be a key feature for the days ahead.
As per the prior analysis, USD/CAD Price Analysis: Bulls take on critical resistance, the price has continued to chip away at the resistance. Still, there are now higher prospects of a move lower as the following charts illustrate:
USD/CAD, daily chart prior analysis
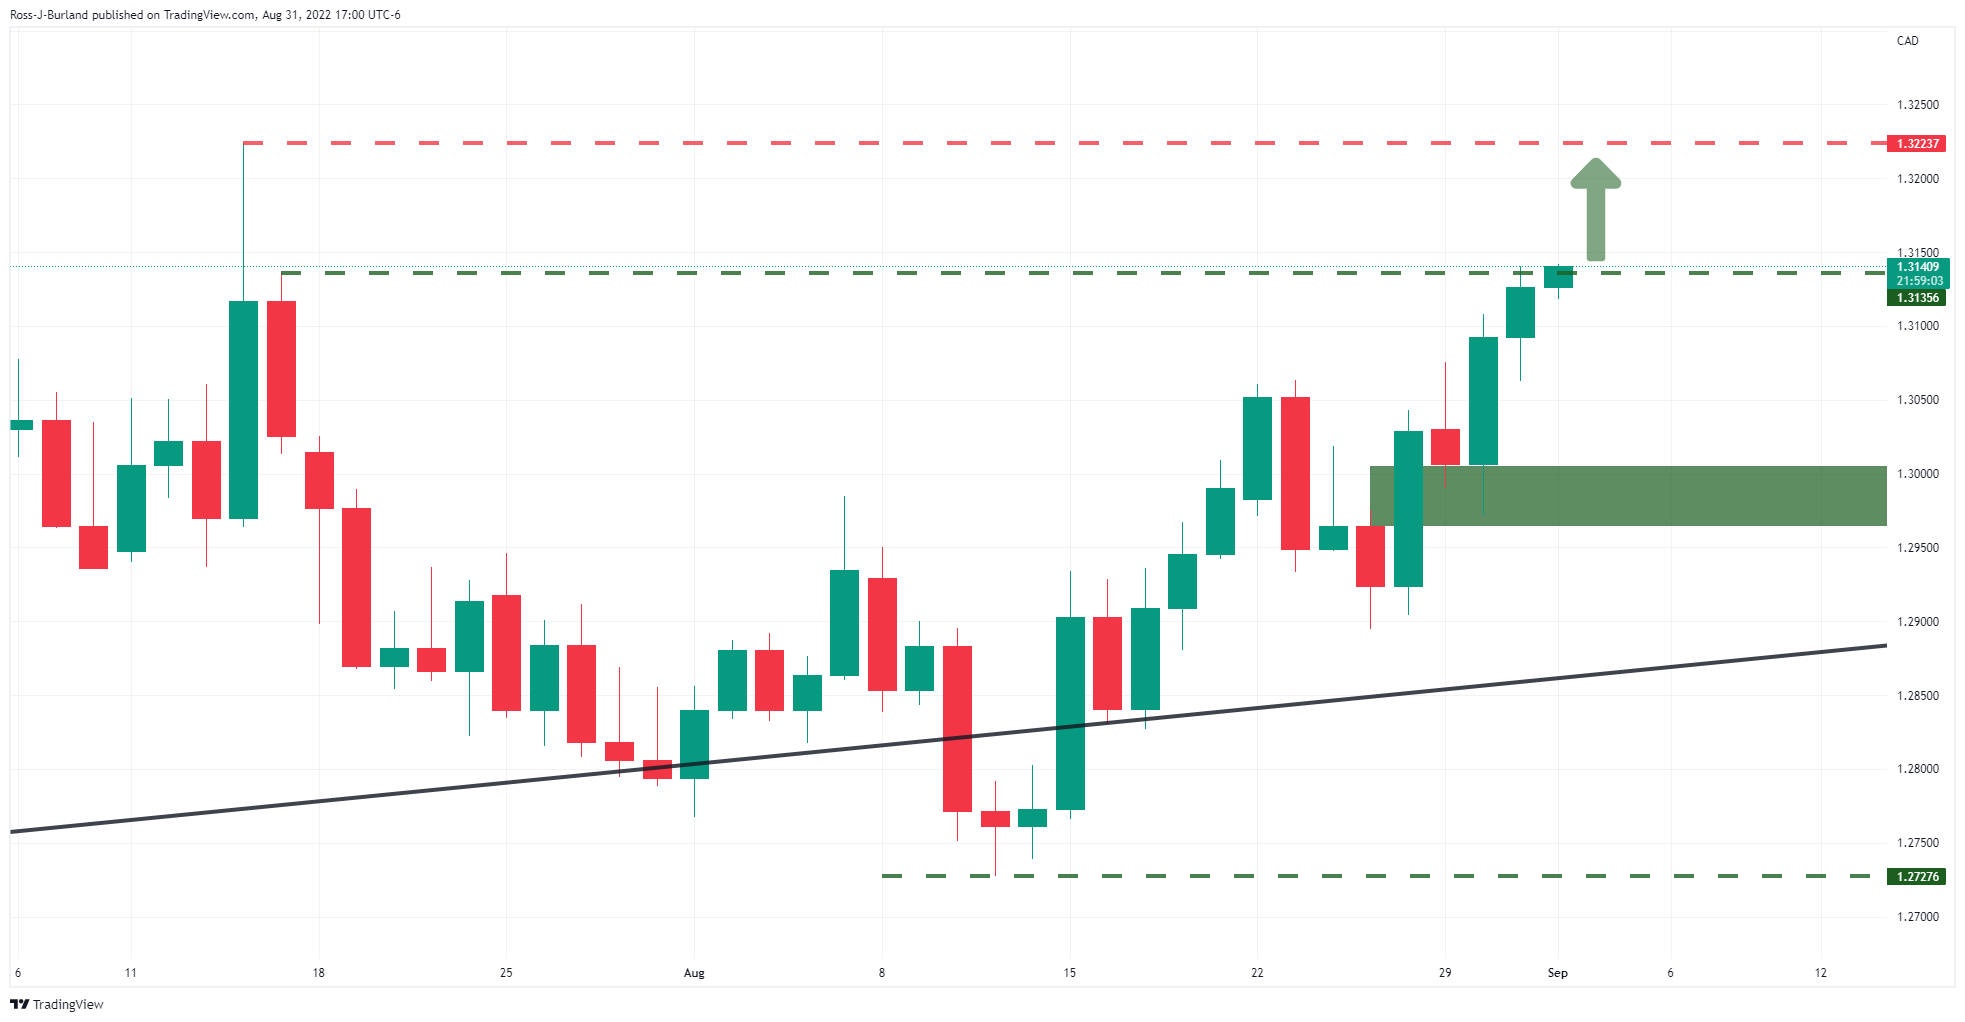
It was explained that from the daily time-frame perspective, there was still room to go until prior highs were met and the break of the last highs of 1.3135 left the bulls with the baton.
We have since seen an extension of the upside on Thursday to test above 1.3200. However, as the chart below demonstrates, the bears are attempting to take over:
USD/CAD weekly chart
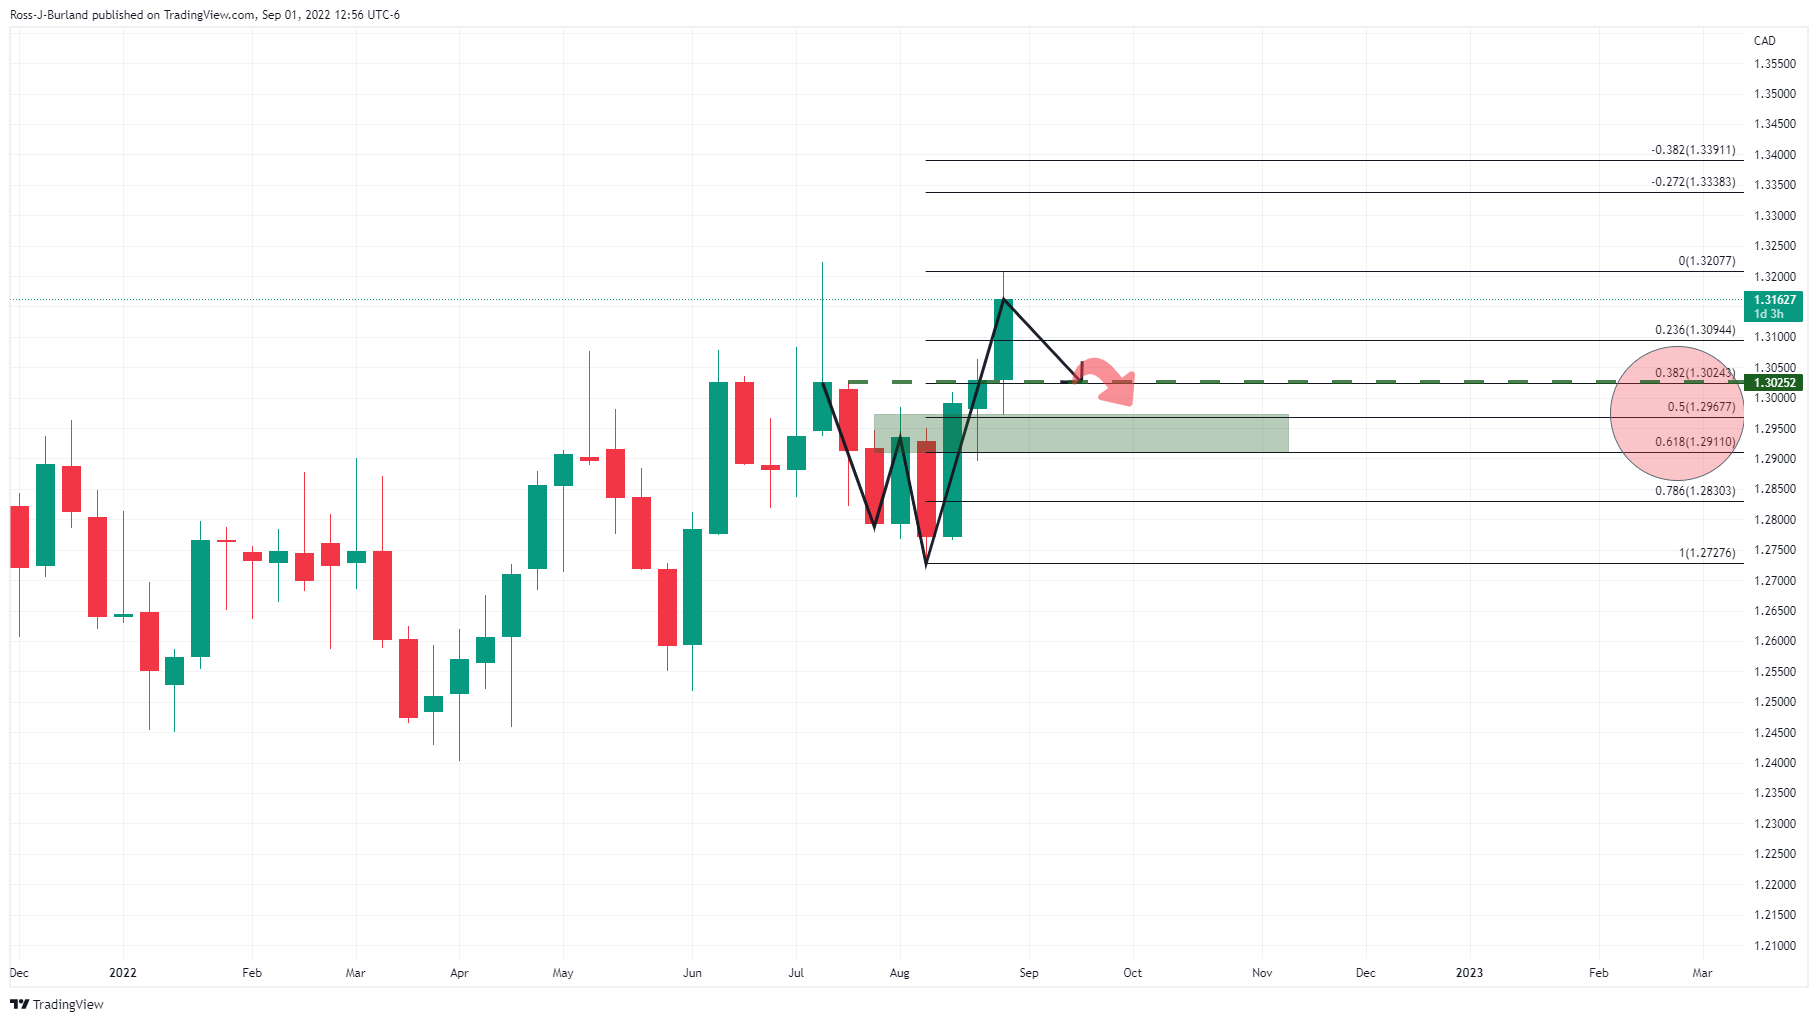
The weekly chart, as its stands, leaves a bearish bias given the W-formation which is a reversion pattern. Should the bears commit at this juncture, then there will be the scope of a significant correction for days ahead forgetting the 38.25 Fibonacci retracements of the current bull leg that meets prior resistance looking left. Below there, we have the 50% and 61.8% ratios aligning with the neckline of the pattern.
USD/CAD H1 chart
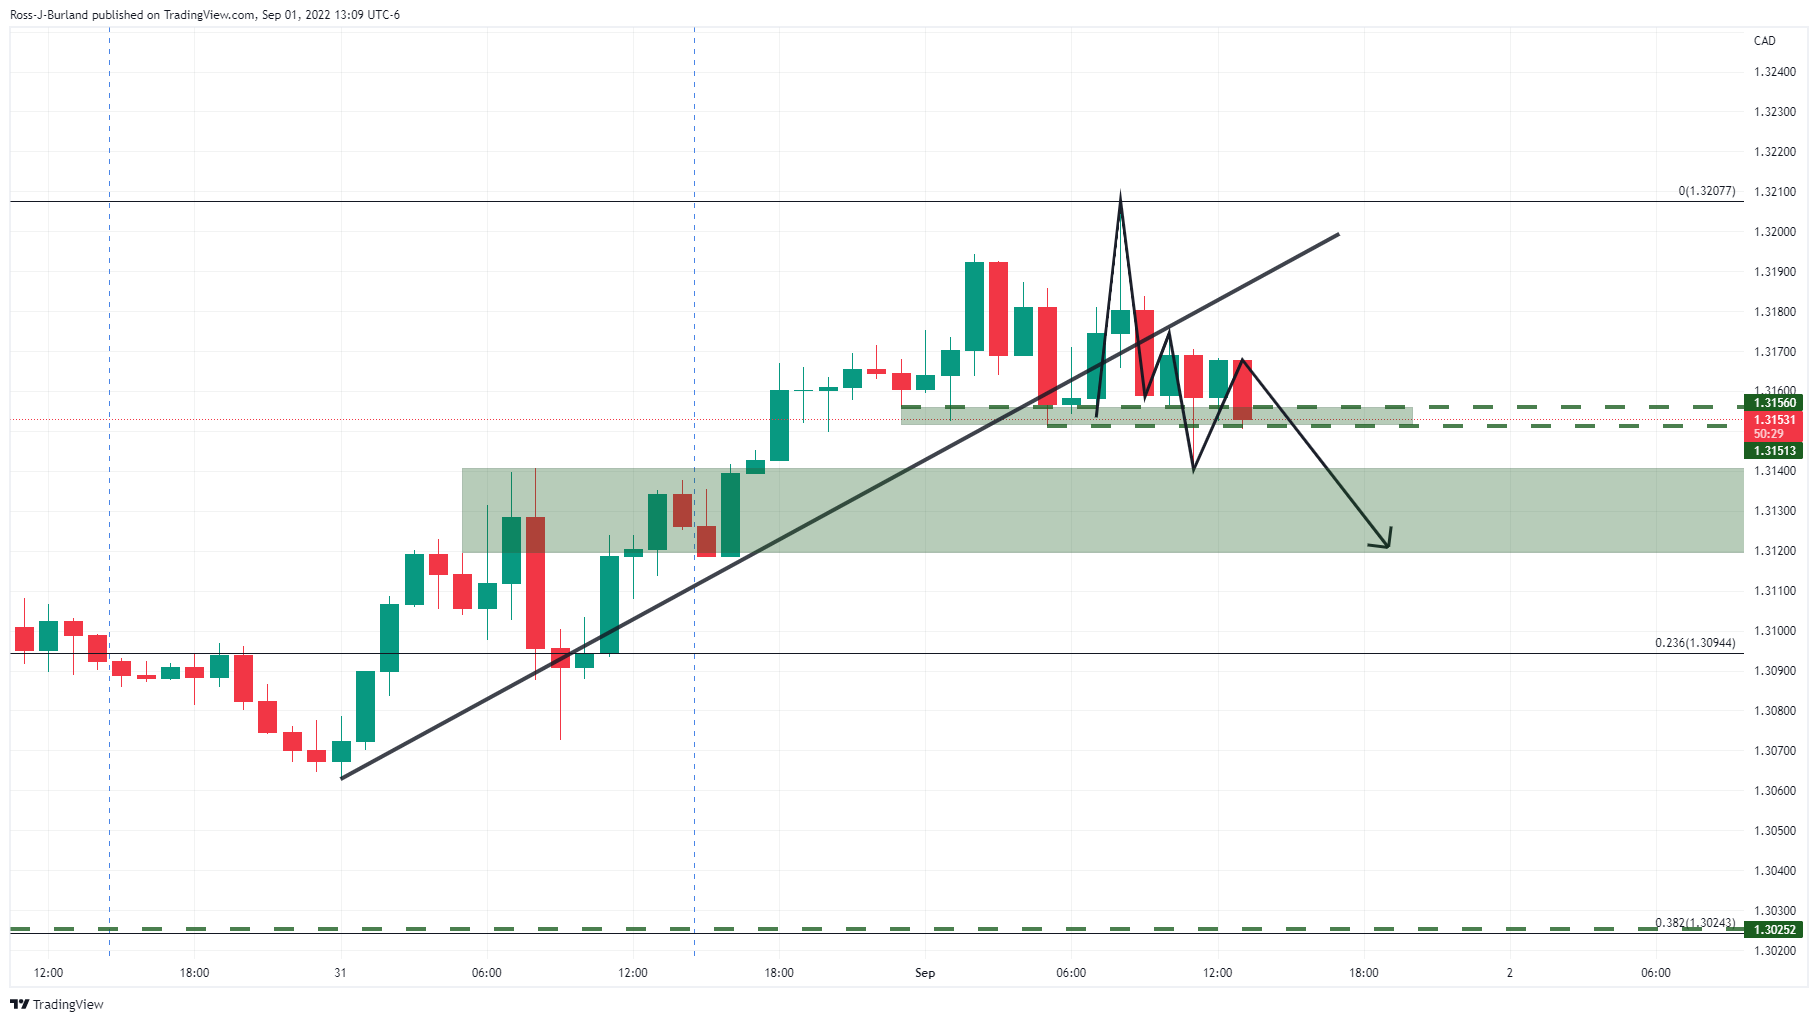
From a nearer-term perspective, the hourly chart shows that the price is attempting a bearish breakout below the structure at 1.3150/56. A break here opens risk of a breakout to the downside as per the weekly chart above.