- USD/MXN Price Analysis: Looking at 19.80 while under 20.00
Notícias do Mercado
5 setembro 2022
USD/MXN Price Analysis: Looking at 19.80 while under 20.00
- USD/MXN with bearish bias in the very short-term, in range.
- Next support below 19.90 at 19.80.
- Critical resistance around 20.20/25.
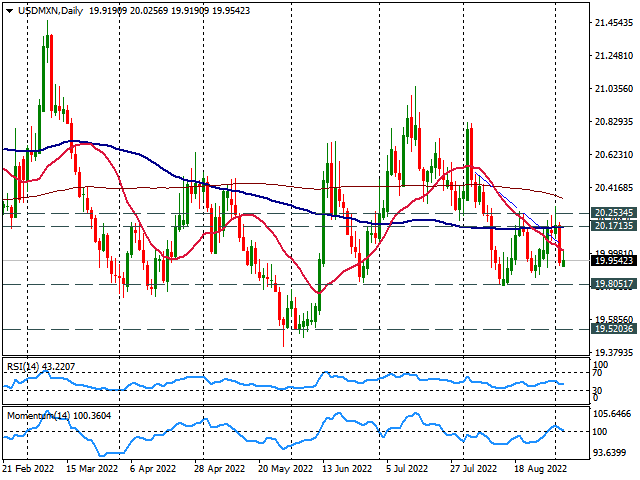
The USD/MXN is rising modestly on Monday as it remains trading near the weekly low it hit at the beginning of the week at 19.91. Momentum and technical indicators point to the downside in the very short-term. A break under 19.90 would expose the next support area at 19.80.
Since mid-August USD/MXN is moving sideways in a range between 19.80 and 20.25. The 19.80 should hold if tested in the near-term, offering a rebound. A firm break lower would weaken the dollar further, exposing 19.72.
On the upside, the immediate resistance stands 20.02 (20-day Simple Moving Average) followed by 20.17. A daily close above 20.25, would change the short-term bias to neutral/bullish and should open the doors to more gains, targeting initially the 20.45 zone.
USD/MXN daily chart
O foco de mercado
Abrir Conta Demo e Página Pessoal