- Gold Price Forecast: XAU/USD attempts a rebound from $1,700, Fed Powell’s speech buzz
Notícias do Mercado
Gold Price Forecast: XAU/USD attempts a rebound from $1,700, Fed Powell’s speech buzz
- Gold price has sensed a buying interest around $1,700.00, downside remains favored on firmer DXY.
- A surprise rise in the US ISM Services PMI data has weakened the precious metal.
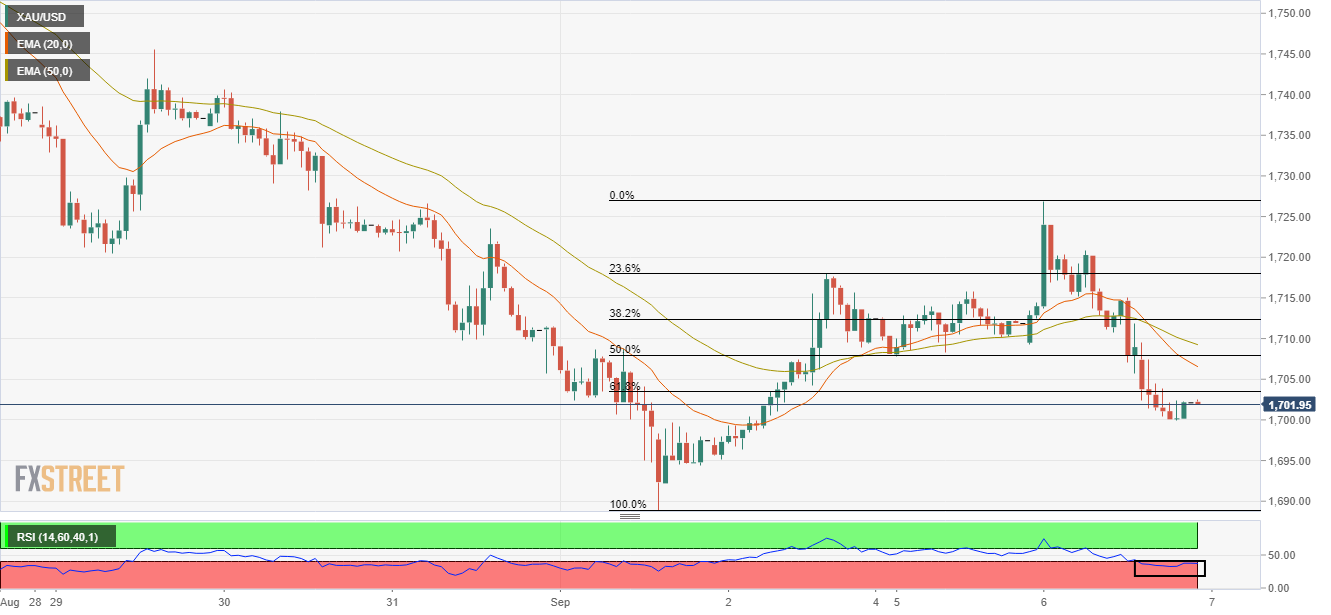
- An establishment below 61.8% Fibo retracement at $1,703.51 is indicating more downside ahead.
Gold price (XAU/USD) has picked bids around the psychological support of $1,700.00 in the early Asian session. The precious metal has fetched a buying interest after displaying a sheer downside. Earlier, the yellow metal witnessed selling pressure after attempting to cross $1,725.00 and accelerated downside momentum after dropping below $1,710.00.
The gold prices fell like a house of cards after the release of surprisingly higher US ISM Services PMI data. As the Federal Reserve (Fed) is hiking interest rates vigorously for the past few months to scale down inflationary pressures, a decline in Services PMI was expected by the market participants. However, the Non-Manufacturing data landed at 56.9 vs. 55.1 the expectations, and 56.7 the prior release.
Later this week, the speech from Federal Reserve (Fed) chair Jerome Powell will be of utmost importance. No doubt, price pressures have already displayed signs of exhaustion and have trimmed to 8.5% in July against 9.1% recorded for June. But, the price rise index is still higher than the desired rate of 2% for the longer term. Therefore, investors should brace for a ‘hawkish’ stance by Fed Powell while addressing the world economy about the interest rates.
Gold technical analysis
On an hourly scale, gold prices have surrendered the 61.8% Fibonacci retracement (placed from Thursday’s low at $1,688.92 to Tuesday’s high at $1,726.84) at $1,703.51. A bear cross, represented by the 20-and 50-period Exponential Moving Averages (EMAs) at $1,711.97, is indicating more weakness ahead.
Meanwhile, the Relative Strength Index (RSI) (14) has shifted into the bearish range of 20.00-40.00, which signals a continuation of downside momentum.
Gold hourly chart