- Gold Price Forecast: XAU/USD aims to recapture $1,700 as DXY displays momentum loss
Notícias do Mercado
Gold Price Forecast: XAU/USD aims to recapture $1,700 as DXY displays momentum loss
- Gold price is attempting a bullish reversal after refreshing its weekly low at $1,693.67.
- The structure of slowing down the pace of hiking interest rates by the Fed is far from over.
- Going forward, the US Retail Sales data will be of utmost importance.
Gold price (XAU/USD) has sensed a buying interest after printing a fresh weekly low of $1,693.67 in the late New York session. The precious metal is required to initially recapture the psychological resistance of $1,700.00 to establish a rebound base and a follow-up recovery extension will be set on autopilot mode. The yellow metal has attempted a recovery as the US dollar index (DXY) is displaying exhaustion signals after a juggernaut rally.
Earlier, gold prices witnessed a bloodbath after a surprise rebound in the US inflation rate. As consensus for the inflation rate was meaningfully lower led by a fall in gasoline prices, investors had started betting that the pace of hiking interest rates by the Federal Reserve (Fed) would slow down now.
The already troublesome job of Fed policymakers is going to be more laborious now as core CPI that excludes food and oil prices has stepped up to 6.3% vs. the expectations of 6.1% and 40 basis points (bps) higher than the prior release.
In today’s session, the US Retail Sales data will be a key trigger. The economic data is not showing any sign of improvement in the overall demand.
Gold technical analysis
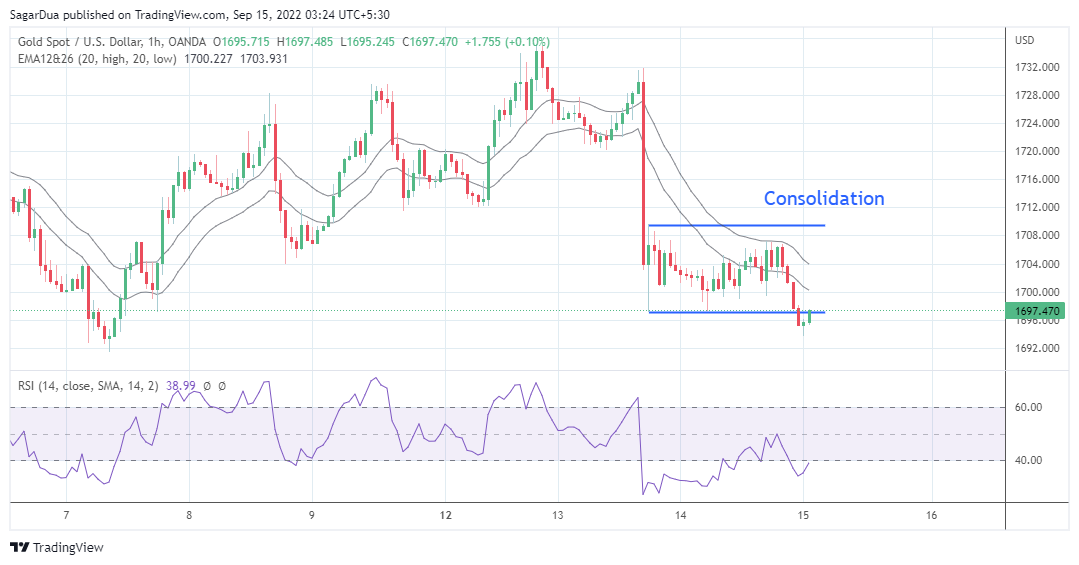
The gold prices are attempting to reclaim the prior consolidation area formed in a narrow range of $1,697.12-1,709.62 on an hourly scale. An occurrence of the same will result in a fakeout and the odds of a bullish reversal will get bolstered. However, this is not enough to claim it a bullish reversal as it will require more filters.
The yellow metal is auctioning below the 20-period (High-Low) Exponential Moving Average (EMA) band. The Relative Strength Index (RSI) is oscillating in the 20.00-40.00 range but the downside momentum seems to fade away.
Gold hourly chart