- EUR/GBP Price Analysis: Negative divergence looms after hitting a fresh YTD high at 0.8787
Notícias do Mercado
EUR/GBP Price Analysis: Negative divergence looms after hitting a fresh YTD high at 0.8787
- The EUR/GBP advances 0.11% during Monday’s North American session.
- Medium-term, as shown by the EUR/GBP daily chart, the pair is upward biased.
- Negative divergence in the 4-hour scale, to tumble the EUR/GBP towards the 0.8700 figure.
The EUR/GBP edges up during the North American session, reaching a fresh YTD high at around 0.8787 but retreated towards the 0.8760s mark, forming a doji, meaning that buyers/sellers are at an equilibrium point. At the time of writing, the EUR/GBP is trading at 0.8767, up by 0.10%.
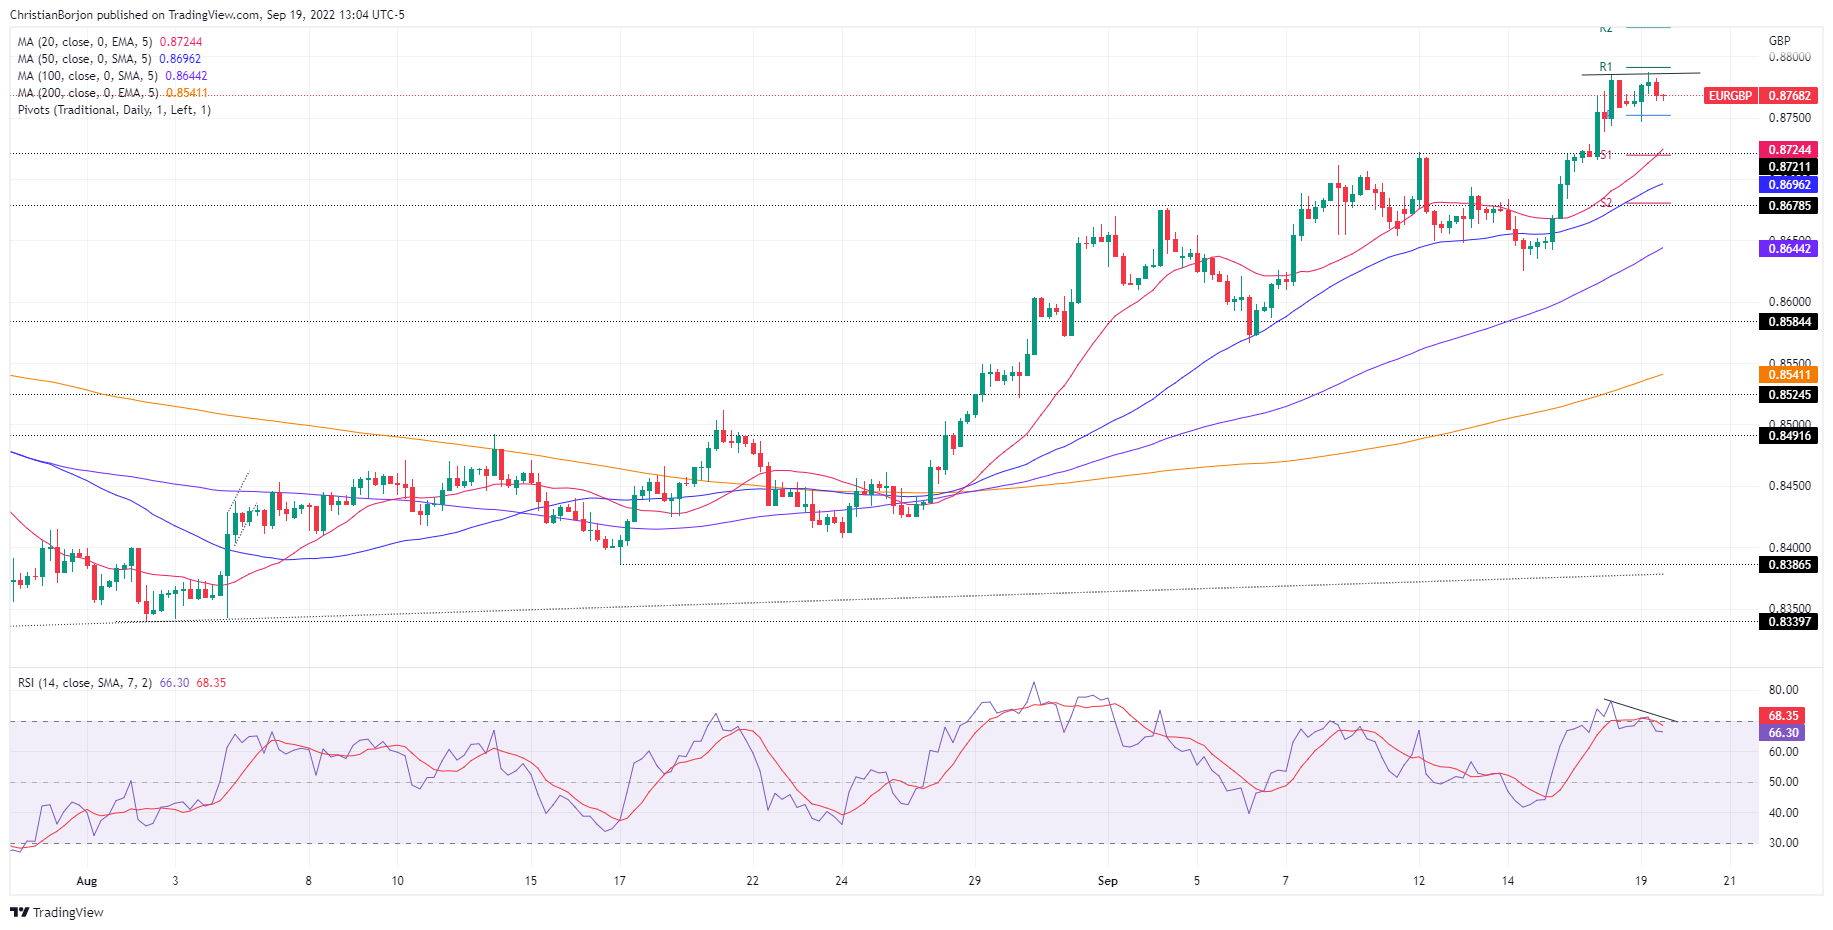
EUR/GBP Price Analysis: Technical outlook
From a daily chart perspective, the EUR/GBP is upward biased, but as the Relative Strength Index (RSI) gets into overbought territory, it might open the door for some consolidation. Additionally, it’s worth noting that there is a negative divergence between price action and the RSI, suggesting that the cross-currency might drop towards the 0.8700 figure or below before resuming its uptrend.
In the near term, the EUR/GBP four-hour scale portrays a divergence, with price action registering higher highs, contrary to RSI’s printing lower highs, meaning that sellers are gathering momentum. Hence, the EUR/GBP in the short term is downward biased.
Therefore, the EUR/GBP first support is the daily pivot of 0.8752. Break below will expose the confluence of the 20-EMA and the S1 daily pivot at the 0.8719/24 range, followed by the 50-EMA at 0.8696, ahead of the S2 daily pivot at 0.8680.
EUR/GBP Key Technical Levels