- GBP/JPY Price Analysis: Buyers threatening to invalidate the head-and-shoulders pattern in the H4
Notícias do Mercado
GBP/JPY Price Analysis: Buyers threatening to invalidate the head-and-shoulders pattern in the H4
- GBP/JPY climbs despite forming a head-and-shoulders chart pattern in the 4-hour chart.
- The UK and Japan were on holiday on Monday, meaning volumes would increase during Tuesday’s session.
- If the GBP/JPY clears the 164.30 mark, that will invalidate the head-and-shoulders chart pattern, paving the path for further gains.
The GBP/JPY snapped four days of consecutive losses and climbed above the 20, 50, and 100-day EMAs on Monday, gaining 0.28%, despite a risk-off impulse in the FX markets. As the Asian session begins, the GBP/JPY is trading at 163.84, above its opening price by 0.08%, at the time of writing.
GBP/JPY Price Analysis: Technical outlook
The GBP/JPY daily chart, remains neutral-to-upward biased, though it should be noted that buyers regained control, clearing resistance levels at the 20, 50, and 100-day EMAs.Furthermore, the Relative Strength Index (RSI) bounced at around the 50-midline, renewing GBP buyers’ hopes for a re-test of the YTD high. A clear break of the 164.30 would pave the way for further gains.
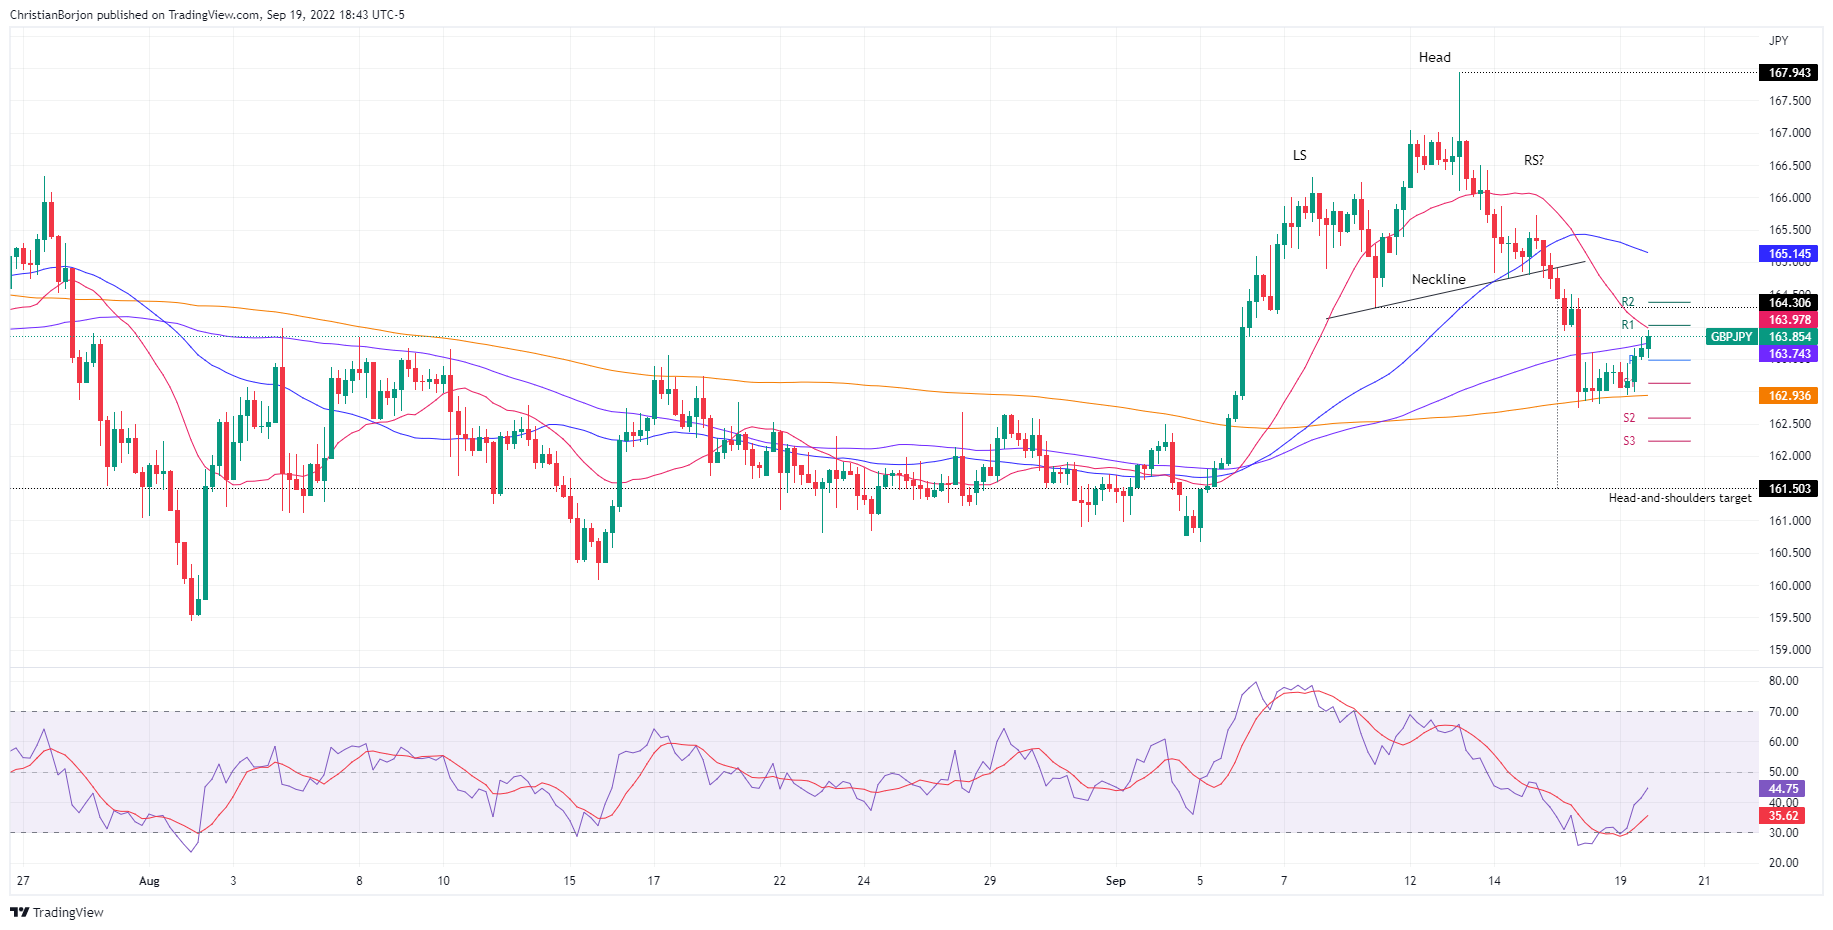
The GBP/JPY 4-hour chart confirms the bearish bias in the near term. A head-and-shoulders chart pattern remains in place, which, measured by the distance of the head-to-the-neckline, would target a drop from current spot prices toward 161.50. Nevertheless, during the last couple of sessions, the GBP/JPY edged towards the neckline at around 164.30, which, once cleared, would negate the pattern, opening the door for higher prices. Otherwise, the GBP/JPY first support would be the daily pivot at 163.50. Break below will expose the S1 pivot at 163.12. A breach of the latter will expose the 200-EMA at 162.93, followed by the S2 daily pivot at 162.69, ahead of the 161.50 targets.
GBP/JPY Key Technical Levels