- USD/JPY Price Analysis: Fluctuates ahead of the 145.00 figure as another FX intervention looms
Notícias do Mercado
USD/JPY Price Analysis: Fluctuates ahead of the 145.00 figure as another FX intervention looms
- The USD/JPY oscillates around Tuesday’s open, above the 144.70 mark.
- The major remains upward biased but approaching the 20-day EMA, which, once cleared, could pave the way for further downside.
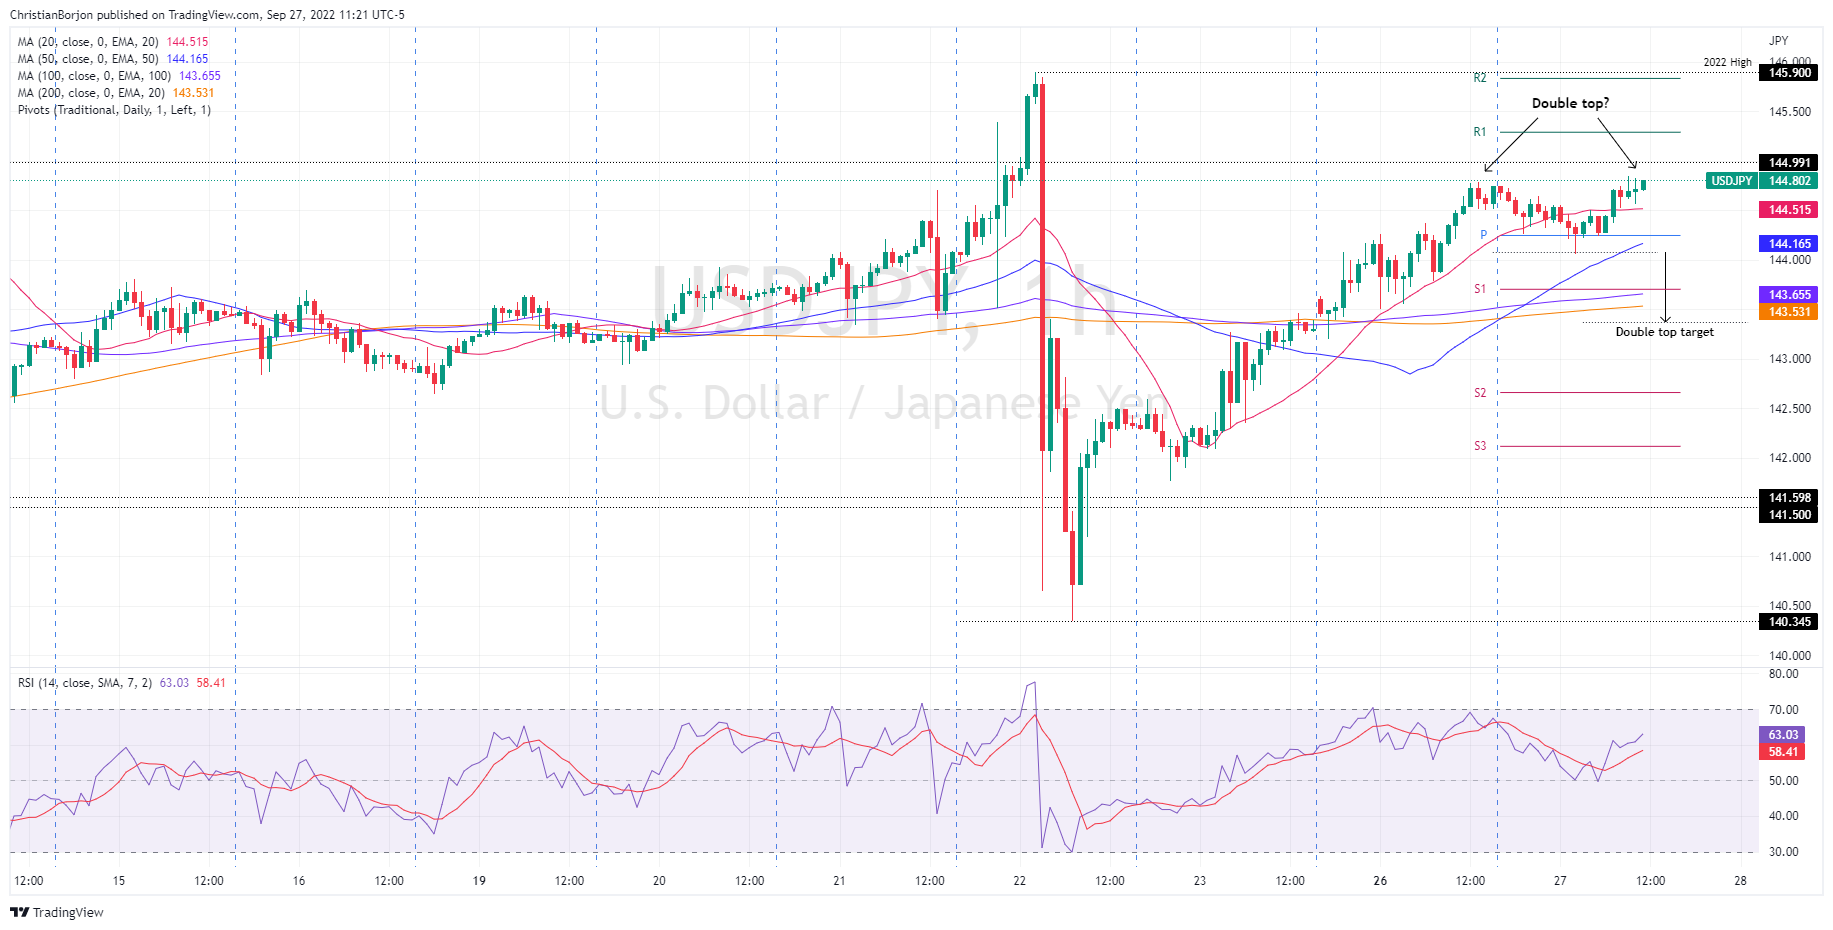
- Short term, the USD/JPY is downward biased, as a double-top emerged in the 1-hour chart.
The USD/JPY fluctuates around the week’s high 144.78, amidst a risk-on impulse, as portrayed by US equities sustaining decent gains following the sell-off of the last couple of trading sessions, courtesy of an upbeat sentiment. At the time of writing, the USD/JPY is trading at 144.80, almost flat.
USD/JPY Price Analysis: Technical outlook
The USD/JPY is range-bound in the 142.00-145.00 range following last week’s intervention. Even though the major remains upward biased, and the 20-day EMA is closing to price action, which means that a break below the latter would exert downward pressure on the pair in the near term.
Short term, the USD/JPY one-hour chart shows that a double-top chart pattern is emerging at around the 144.60-75 area, which could pave the way for further losses. Nevertheless, the 20 and the 50-EMAs, meandering around 144.51 and 144.16, respectively, would be difficult to surpass. But once cleared, a fall towards the S1 daily pivot at around 143.70 is on the cards.
On the flip side, the USD/JPY’s first resistance would be the 145.00 figure, the line in the sand imposed by the Bank of Japan, last week’s intervention. Break above will expose the YTD high at 145.90, ahead of the 146.00 figure.

USD/JPY Key Technical Levels