- Gold Price Forecast: XAU/USD turns sideways around $1,630 as investors await Fed Powell’s speech
Notícias do Mercado
Gold Price Forecast: XAU/USD turns sideways around $1,630 as investors await Fed Powell’s speech
- Gold prices are displaying topsy-turvy moves at around $1,630.00 ahead of Fed Powell’s speech.
- Fed’s chosen approach for the remaining 2022 will set the grounds for the rate hike cycle of 2023.
- Upbeat Consumer Confidence and a lower-than-expected decline in durable goods demand strengthened DXY.
Gold price (XAU/USD) is displaying a dull performance as investors have sidelined ahead of the speech from Federal Reserve (Fed) chair Jerome Powell. The precious metal is juggling around $1,630.00 after a modest decline from the critical hurdle of $1,640.00. Exhaustion in the downside momentum has contracted asset’s volatility and topsy-turvy movements are expected ahead.
On Wednesday, the yellow metal will dance to the tunes of the speech from Fed Powell. Considering the ongoing situation, Fed Powell will sound ‘hawkish’ and will guide on further policy tightening. Things will be focused on the roadmap of rate hikes for the remaining 2022 as the chosen approach will set the grounds for 2023’s rate hike cycle.
Meanwhile, the US dollar index (DXY) is aiming to capture 115.00 for the first time in the past two decades. Lower-than-expected decline in the US Durable Goods Orders data and an upbeat Consumer Confidence have strengthened the DXY bulls. The decline in demand for Durable Goods was recorded at 0.2% against the expectations of a decline of 0.4%. While the Consumer Confidence improved to 108.0 vs. the prior release of 103.6.
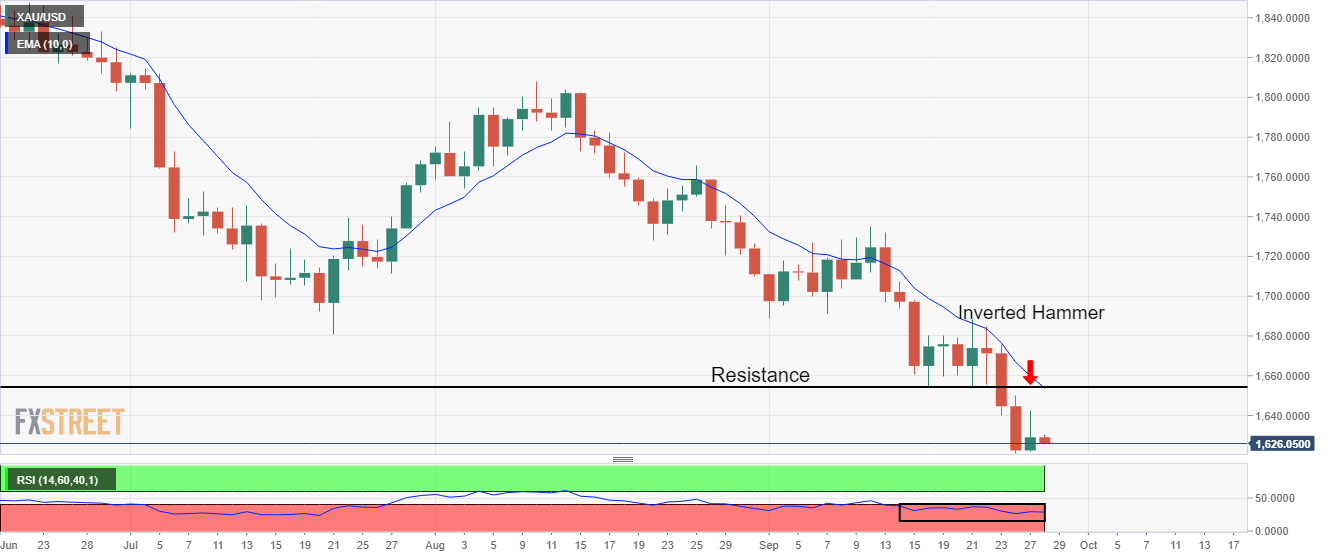
Gold technical analysis
Gold prices have formed an Inverted Hammer candlestick pattern on the daily scale. There are two schools of thought for the aforementioned candlestick in which the traditional believes that the formation is a sign of reversal while the unconventional considers it bearish as sellers emerged while the settlement of the prices. Also, buyers didn’t carry positions overnight.
The horizontal resistance placed from September 16 low at $1,654.17 will act as a major hurdle for the counter.
The declining 10-period Exponential Moving Average (EMA) at $1,653.85 adds to the downside filters. While, the Relative Strength Index (RSI) (14) is oscillating in oversold territory below 30.00, which indicates that a pullback move cannot be ruled out.
Gold daily chart