- Gold Price Forecast: XAU/USD marches towards $1,680 ahead of US PCE Inflation
Notícias do Mercado
Gold Price Forecast: XAU/USD marches towards $1,680 ahead of US PCE Inflation
- Gold price is accelerating towards $1,680.00 as the DXY has extended its losses.
- A consecutive decline in the US GDP numbers weakened the DXY.
- US core PCE price index is expected to advance by 10 bps to 4.7%.
Gold price (XAU/USD) is aiming to test the critical hurdle of $1,680.00 amid ongoing weakness in the US dollar index (DXY). The precious metal extended its recovery after sustaining above $1,650.00 and is expected to remain in the grip of bulls ahead. The yellow metal concluded its corrective move towards $1,640.00 and got strengthened after the US Gross Domestic Product (GDP) remained in line with the projections.
The US GDP has consecutively declined by 0.6% on an annualized basis. It seems that the consequences of the bigger rate hikes by the Federal Reserve (Fed) have started showing their true colors. Bets were rising over a possible recession situation in the US but got vanished after the commentary from San Francisco Fed chief Mary Daly.
Fed policymaker believes that the central bank is needed to drop focusing on generating more employment to tame the galloping inflation and not a recession, as reported by Reuters.
Going forward, the US core Personal Consumption Expenditure (PCE) price index data will remain in focus. The economic data is expected to improve to 4.7% vs. the prior release of 4.6%. A higher-than-expected figure could propel the DXY to sum up its correction sooner.
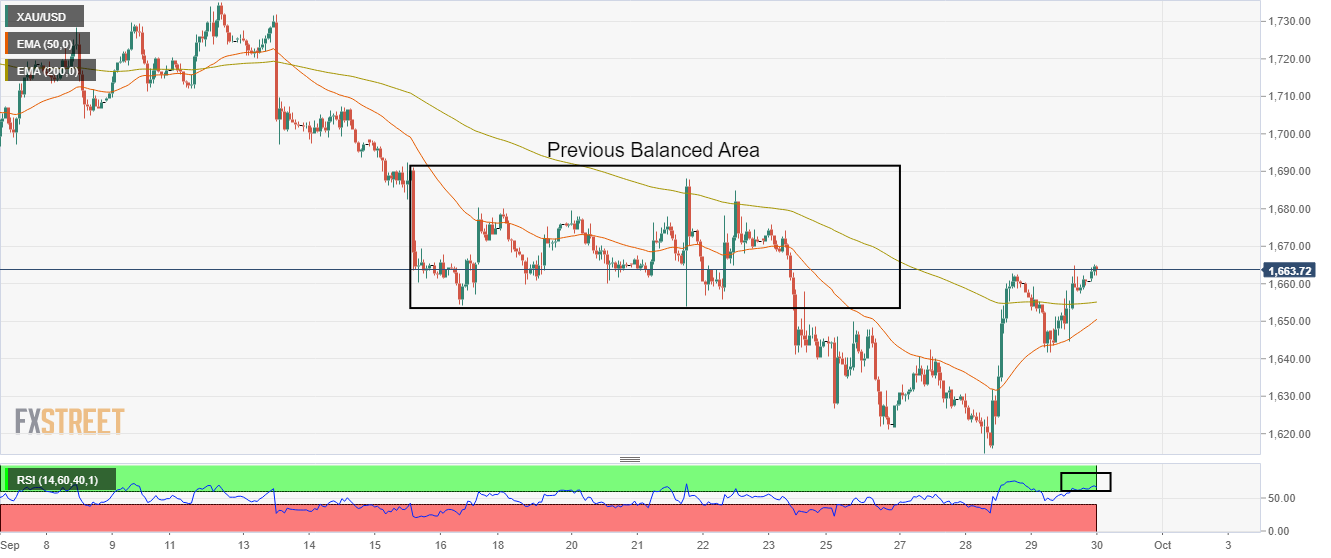
Gold technical analysis
Gold prices have entered the prior balanced area, which is placed in a range of $1,653.30-1,692.00 on an hourly scale. The balanced area indicates the highest auction region where most of the trading activity took place.
It is worth noting that the gold prices have crossed the 50-and 200-period Exponential Moving Averages (EMAs) while the EMAs have not displayed a crossover yet. This signals the strength of the upside momentum.
Adding to that, the Relative Strength Index (RSI) (14) has shifted into the bullish range of 60.00-80.00, which illustrates a continuation of upside momentum.
Gold hourly chart