- GBP/USD Price Analysis: Teases sellers above 1.1055 support, US PCE Inflation, UK GDP eyed
Notícias do Mercado
GBP/USD Price Analysis: Teases sellers above 1.1055 support, US PCE Inflation, UK GDP eyed
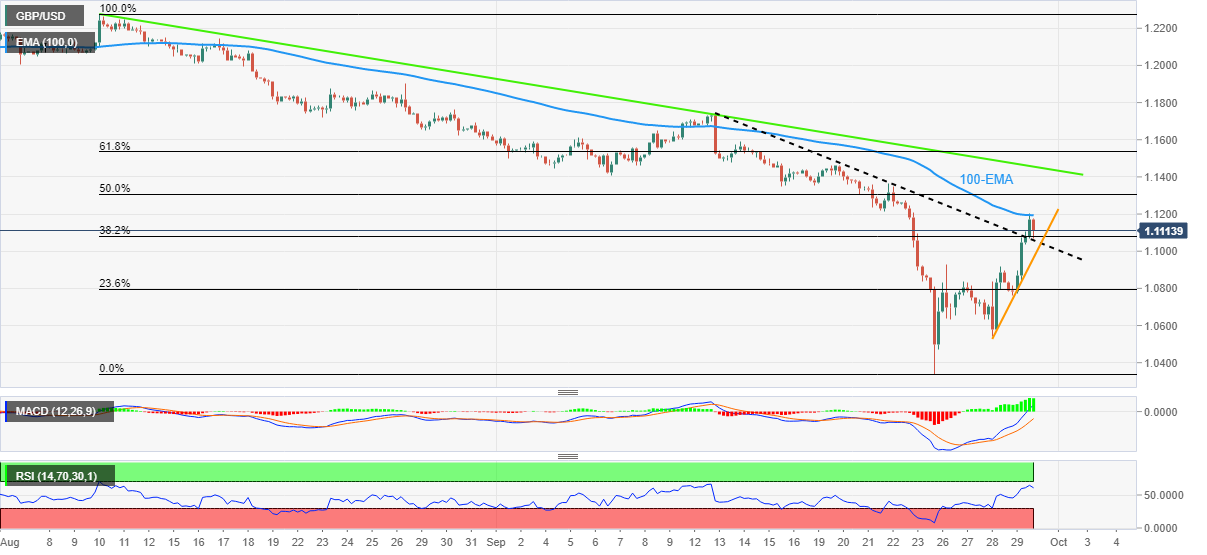
- GBP/USD struggles to extend two-week-old resistance breakout as 100-EMA tests buyers.
- Pre-data anxiety, nearly overbought RSI (14) challenge immediate upside.
- Sellers need validation from two-day-old support, scheduled data to retake control.
GBP/USD struggles for clear directions around the weekly top after a three-day uptrend as traders await the key statistics from the US and the UK during Friday. That said, the quote currently seesaws between the 100-EMA and the resistance-turned-support line while taking rounds to 1.1120.
It’s worth noting that the nearly overbought RSI conditions join the 100-EMA and the previous resistance line to challenge the pair’s latest moves, as well as the pre-data anxiety.
Also read: GBP/USD pause on the way to 1.1200 ahead of UK GDP, US PCE Inflation
It should be noted, however, that the comparative fundamental challenges for the UK and a seven-week-old resistance line portray the bearish bias for the GBP/USD pair.
Hence, sellers should be on the lookout for entries on a clear downside break of the immediate support line, near 1.1055 by the press time. Following that, an upward sloping support line from Wednesday, near 1.0965, could challenge the pair’s further downside.
Alternatively, an upside clearance of the 100-EMA hurdle, around 1.1195 at the latest, could aim for the downward sloping resistance line from August 10, near 1.1455 now.
If at all the GBP/USD buyers manage to cross the 1.1455 hurdle, the monthly high surrounding 1.1740 will be on their radar.
GBP/USD: Four-hour chart

Trend: Pullback expected