- GBP/USD bulls run into a wall of critical resistance
Notícias do Mercado
GBP/USD bulls run into a wall of critical resistance
- GBP/USD bears are lurking at a key confluence area of resistance.
- The tables could be turning in terms of the outlook for the Fed and UK politics.
- Bulls eye a significant breakout on higher time frames.
GBP/USD has been whipsawed on Tuesday in a day that ran through a vast territory for a fresh high for the week so far at 1.1489 from a low of 1.1280. The US dollar was hit hard on the back of poor JOLTS data that has accompanied weak Manufacturing data and prospects of a less hawkish Federal Reserve.
The bears are out to get the greenback and have pushed the pound towards extremes as per the longer-term charts in what has been a very strong bullish correction over the past two weeks from record lows.
The dollar slid against major currencies and along with yields, it would appear to reflect the market participants' views on the outlook for interest rates. At the same time, participants in the sterling money markets welcomed the British government's U-turn on some tax cuts. The pound dropped to a record low of $1.0327 on Sept. 26 and bond prices tumbled following the unveiling of the new government's plans to slash taxes, particularly for the rich, and ramp up borrowing.
However, it was not a popular plan and the plans to get rid of the 45% top rate of income tax has helped the pound to recover, adding to gains that were sparked by the Bank of England (BoE) last week restarting its bond-buying programme following a dramatic plunge in long-dated gilts.
Meanwhile, US yields, which move inversely to prices, were pressured at the start of the week and stayed low on Tuesday on more weak data in the JOLTS Job Openings. This is a survey done by the US Bureau of Labor Statistics to help measure job vacancies. It collects data from employers including retailers, manufacturers and different offices each month:
-638005016651390367.png)
US job openings fell to almost 10.1 million in August, according to the Bureau of Labor Statistics, below the consensus on Econoday for 11.15 million and down from 11.17 million reported in July. The larger-than-expected decline could be the first sign that demand for labour is falling ahead of this week's main event in the US Nonfarm Payrolls data. The weaker data has caused traders to bet the Federal Reserve may raise interest rates less than previously expected.
GBP/USD technical analysis
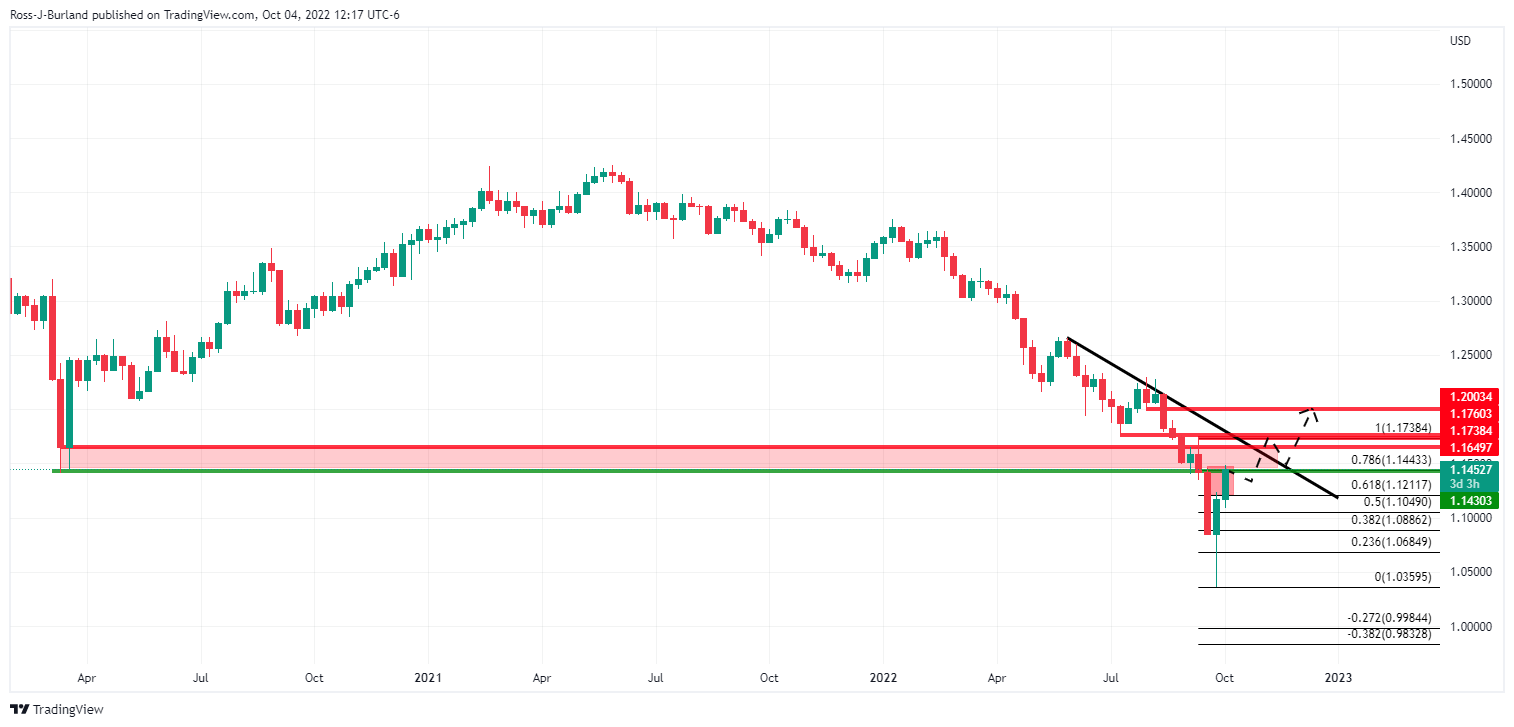
The weekly outlook is bullish as per the strong recovery. However, the price is running into a wall of a confluence of resistances that include old lows, highs, trendline and high volumes. This would open the prospects of a meanwhile correction for the immediate future which could mean that we have seen the high of the week on Tuesday's trade.

The hourly chart's structures could come under pressure should the price now start to decelerate on the bid and chip into and consequently break the trendline support as the first bearish leading indicator in terms of price action.