- Gold Price Forecast: XAU/USD bears are lurking in daily moving average cloud and confluence of resistance
Notícias do Mercado
Gold Price Forecast: XAU/USD bears are lurking in daily moving average cloud and confluence of resistance
- Gold has rallied towards last week's highs as the US dollar and yields drop, risk rallies.
- Gold bears focus on the downside and a 50% mean reversion near the $1,685/75 area.
The gold price rallied on Tuesday printing a fresh high for the week so far around $1,730 and traders have their sights set on September's high of $1,735. The yellow metal rallied from a low of $1,695.24 on the day as the US yields made fresh lows of 3.564% in the benchmark 10-year Treasury yield while the US dollar got smacked down on yet further data disappointments.
The DXY, which measures the greenback vs. a basket of currencies fell from a high of 111.886 for the day, or 110.870 on the following JOLTS data:
-638005016651390367.png)
US job openings fell to almost 10.1 million in August, according to the Bureau of Labor Statistics, below the consensus on Econoday for 11.15 million and down from 11.17 million reported in July. The larger-than-expected decline could be the first sign that demand for labour is falling ahead of this week's main event in the US Nonfarm Payrolls data. The weaker data has caused traders to bet the Federal Reserve may raise interest rates less than previously expected as the central bank turns more dovish as the US economy slows.
Elsewhere, also weighing on the greenback, US stocks advanced on signs that the supply-demand gap in the labour market was narrowing, a dovish factor that is supportive of risk appetite on Wall Street. The Dow Jones Industrial Average jumped 2.7% to 30,308.63, while the S&P 500 gained nearly 3% to 3,789.49. The Nasdaq Composite was over 3.5% higher at 11,609 with all sectors in the green after midday Tuesday.
All in all, risk appetite is back in vogue. Volatility is helping to elevate the price of gold, buoyed by expectations that central banks may ease the pace at which they tighten monetary policy resulting in US equity markets recording their strongest rebound since November 2020. However, views are mixed as to whether markets have now bottomed out or whether this recovery will be short-lived.
''We expect another beat on this week's nonfarm payroll data on Friday, which could present be a catalyst for a repricing lower,'' analysts at TD Securities argued. ''The pain trade is still to the downside in precious metals, and the latest positioning data highlighted that other reportables started to meaningfully liquidate their gold length, suggesting pressure towards a capitulation in gold is indeed building.''
Gold technical analysis
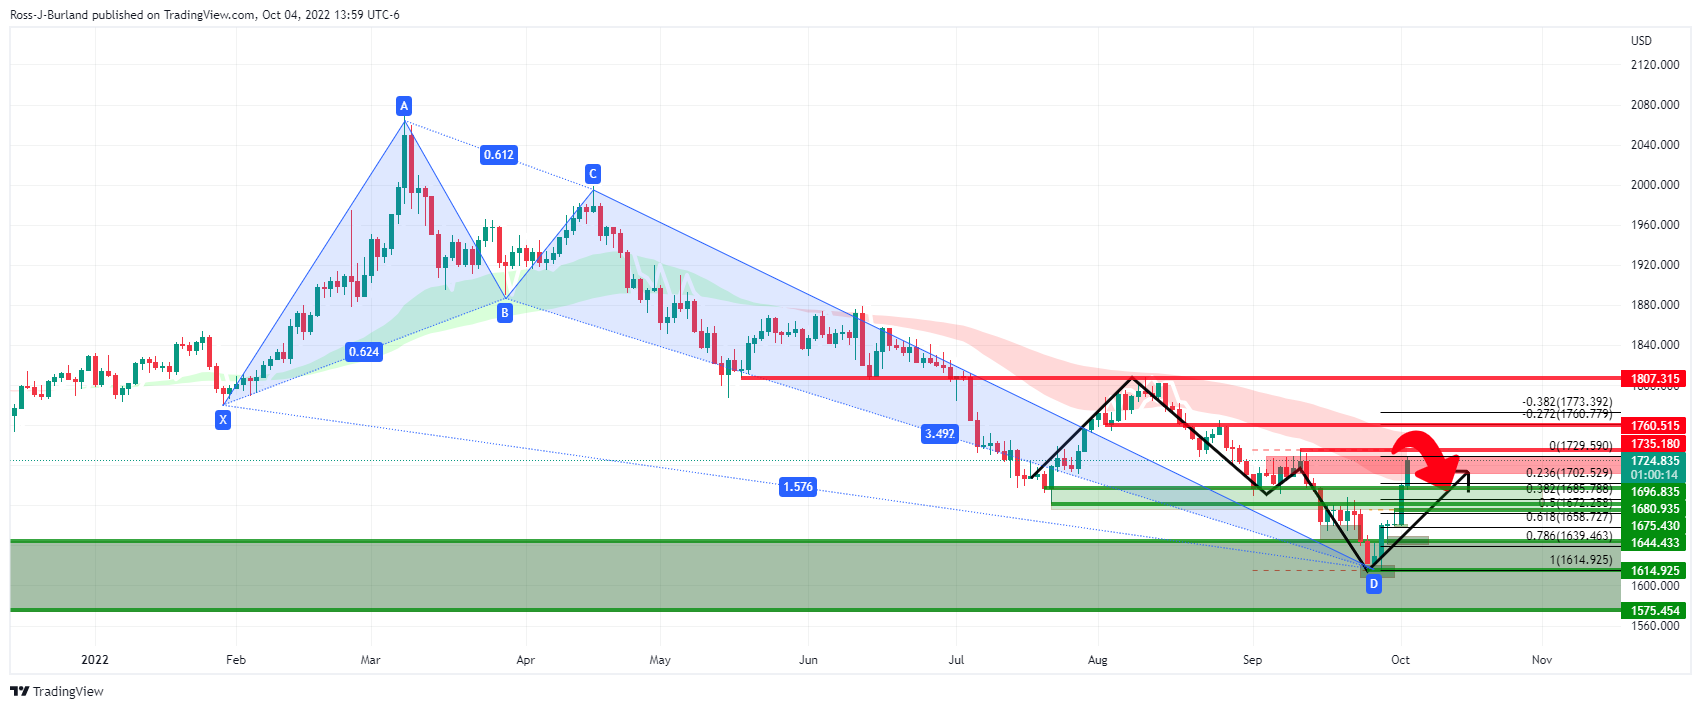
The daily chart has seen the price rejected higher as per the harmonic Crab which is a bullish pattern. The bulls are running into an area of potential resistance as per the weekly M-formation and prior week's highs as well as a 21/50 smoothed moving average cloud. For the day ahead, being the middle of the week, if this is going to be the highs of the week, then there will be a focus on the downside and that exposes a 50% mean reversion near the $1,685/75 area.