- Gold Price Forecast: XAU/USD eyes a break above $1,730 amid weaker consensus for US NFP
Notícias do Mercado
Gold Price Forecast: XAU/USD eyes a break above $1,730 amid weaker consensus for US NFP
- Gold prices are aiming to smash the 61.8% Fibo retracement at $1,734.58.
- Fed’s soaring interest rates have trimmed employment generation opportunities.
- The Average Hourly Earnings data is expected to decline by 10 bps to 5.1% on an annual basis.
Gold price (XAU/USD) has witnessed a juggernaut rally after demolishing the psychological hurdle of $1,700.00. The precious metal is oscillating around Tuesday’s high at $1,729.00 and is expected to break the same with sheer confidence. The yellow metal has shifted into positive territory and is expected to continue its six-day winning streak after crossing the immediate hurdle of $1,730.00.
Weaker estimates for the US employment data are strengthening the gold prices. Escalating interest rates by the Federal Reserve (Fed) to combat the mounting inflation has trimmed employment opportunities. The corporate has left with no other option than to postpone the capacity expansion and investment plans to avoid higher interest obligations. This is resulting in a slowdown in the job creation process.
As per the expectations, the US Nonfarm Payrolls (NFP) data will decline to 250k vs. the prior release of 315k. The jobless rate is seen as stable at 3.7%. Apart from that, the Average Hourly Earnings data will remain in focus, which is expected to trim by 10 basis points (bps) to 5.1% on an annual basis.
Meanwhile, the US dollar index (DXY) has slipped to near the psychological support of 110.00. The DXY will continue to remain on the tenterhooks amid a decline in the employment generation process.
Gold technical analysis
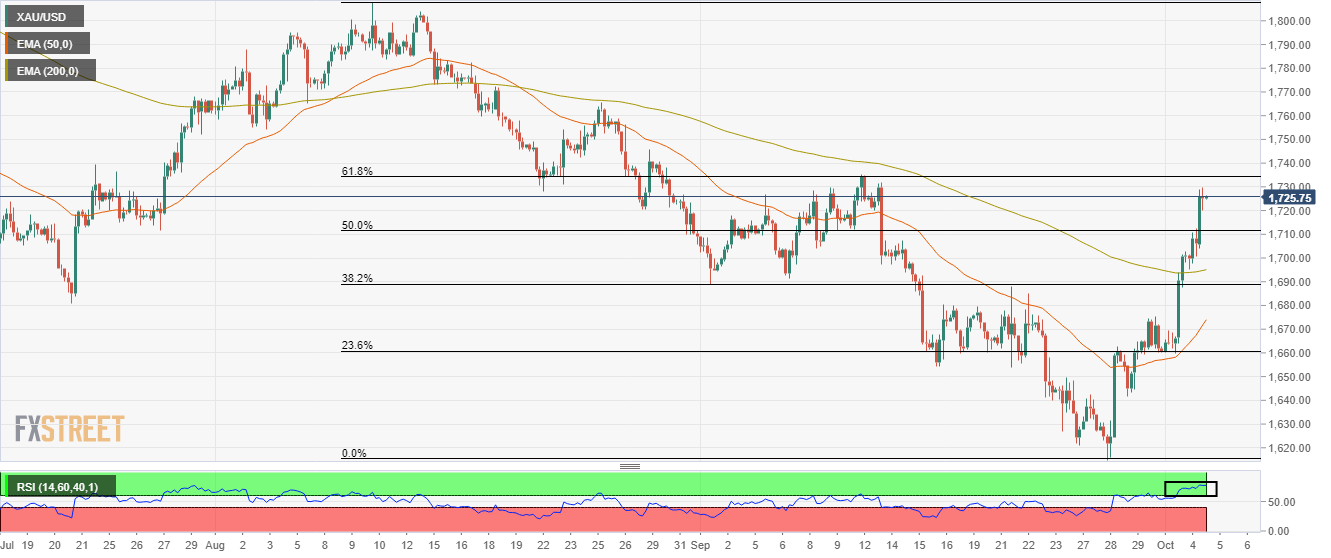
On a four-hour scale, gold prices are near to hitting the 61.8% Fibonacci retracement (placed from August 10 high at $1,807.93 to September low at $1,614.85) at $1,734.58. The upside momentum is extremely strong as the asset has crossed the 50-and 200-period Exponential Moving Averages (EMAs) at $1,674.30 and $1,695.80 respectively while the 50-EMA is still lower than the longer one.
The Relative Strength Index (RSI) (14) has been established in the bullish range of 60.00-80.00, which indicates that bullish momentum has been activated.
Gold four-hour chart