- Gold Price Forecast: XAU/USD bulls target $1,735 as focus shifts to US NFP – Confluence Detector
Notícias do Mercado
Gold Price Forecast: XAU/USD bulls target $1,735 as focus shifts to US NFP – Confluence Detector
- Gold price is back on the bids amid a subdued US dollar alongside yields.
- Investors assess mixed US data and the Fed rate hike bets amid a better mood.
- XAU/USD bulls keep their sight on the $1,735 barrier ahead of US NFP.
Gold price is finding fresh demand in Thursday’s trading so far, reverting towards three-week highs amid a broadly subdued US dollar and lackluster performance in the Treasury yields. Markets are in a risk-on mood, implying that they are ignoring the impact of surging oil prices while cheering hopes for not-so-aggressive Fed, especially after the US ISM Services Price Paid component softened more than expected in September. However, the US ADP employment data outpaced expectations of 200K, arriving at 208K in the reported month. All eyes now remain focused on Friday’s US Nonfarm Payrolls release for a fresh direction in the dollar, as well as, in the yellow metal.
Also read: Gold Price Forecast: Bulls not ready to give up
Gold Price: Key levels to watch
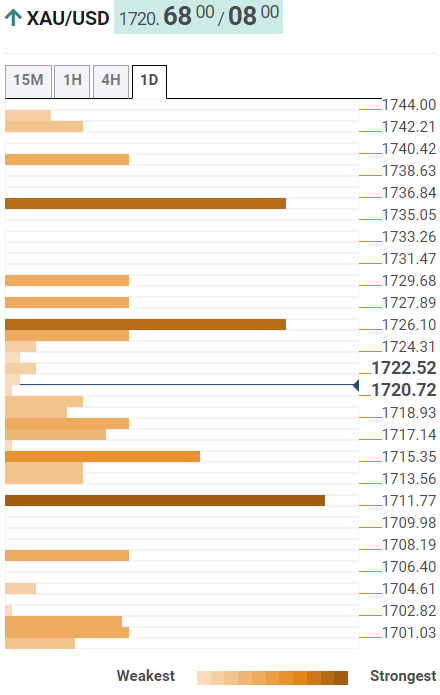
The Technical Confluence Detector shows that the gold price is yearning for acceptance above the convergence of the SMA50 one-day and pivot point one-month R1 at $1,724.
The previous day’s high of $1,728 will test bulls’ immediate upside, above which the pivot point one-day R1 at $1,730 needs to be cleared to kickstart a fresh rally towards the previous month’s high of $1,735.
On the flip side, bulls will draw support from the Fibonacci 61.8% one-day at $1,718, below which sellers will target the previous low four-hour at $1,715.
The confluence of the Fibonacci 38.2% one-day and pivot point one-week R2 at $1,712 will be a tough nut to crack for XAU bears.
Here is how it looks on the tool
About Technical Confluences Detector
The TCD (Technical Confluences Detector) is a tool to locate and point out those price levels where there is a congestion of indicators, moving averages, Fibonacci levels, Pivot Points, etc. If you are a short-term trader, you will find entry points for counter-trend strategies and hunt a few points at a time. If you are a medium-to-long-term trader, this tool will allow you to know in advance the price levels where a medium-to-long-term trend may stop and rest, where to unwind positions, or where to increase your position size.