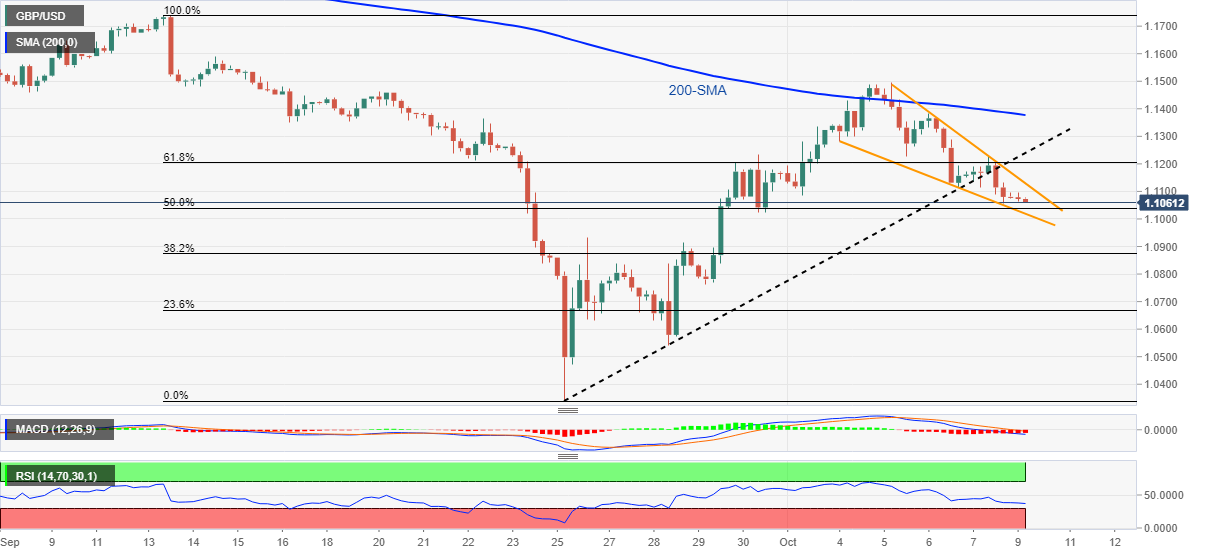
- GBP/USD Price Analysis: Falling wedge tests bears below 1.1100
Notícias do Mercado
GBP/USD Price Analysis: Falling wedge tests bears below 1.1100
- GBP/USD remains pressured around one-week low, down for the fourth consecutive day.
- Bullish chart formation, nearly oversold RSI (14) challenge bears.
- Buyers need sustained break of 200-SMA to keep the reins.
GBP/USD bears take a breather around 1.1070 during Monday’s Asian session, probing the three-day downtrend inside an immediate falling wedge bullish chart formation.
It should be noted, however, that the bearish MACD signal and the quote’s successful break of the previous day's support line from September 26, as well as a clear U-turn from the 200-SMA, keeps the sellers hopeful.
Even so, the downside break of a three-day-old falling wedge’s lower line, around 1.1020, becomes necessary for the bears to keep reins.
Following that, a downward trajectory towards 1.0800 and the previous monthly low near 1.0340 will lure the GBP/USD bears.
On the contrary, a clear upside break of the stated wedge’s upper line, close to 1.1130, will confirm the bullish chart formation and propel the GBP/USD prices towards the previous monthly peak near 1.1740.
In a case where the Cable pair rises past 1.1740, July’s low near 1.1760 and late August swing high around 1.1900 could challenge the pair buyers before giving them control.
Overall, GBP/USD is likely to remain pressured but the downside room appears limited.
GBP/USD: Four-hour chart

Trend: Limited downside expected