- GBP/JPY Price Analysis: Fluctuates between the 20/200-DMA on a risk-off mood
Notícias do Mercado
GBP/JPY Price Analysis: Fluctuates between the 20/200-DMA on a risk-off mood
- GBP/JPY is slightly up, but the Japanese intervention looming might likely stall the rally.
- The GBP/JPY trapped between the 20/200-DMA at around 161.26-160.65.
- Short term, the GBP/JPY is neutral-to-downward biased, and once it clears 161.00, a fall toward 160.00 is on the cards.
The GBP/JPY slightly advances as the Asian Pacific session begins, up by a minimal 0.03%, after finishing Monday’s trading day almost flat, seesawing between the 20 and 200-day EMAs. At the time of writing, the GBP/JPY is trading at 161.11.
GBP/JPY Price Forecast
From a daily chart perspective, the GBP/JPY is neutral-biased. However, it is worth noting that the cross-currency is approaching the 200-day EMA at 160.65, which, if broken, would exacerbate a fall toward the 50% Fibonacci retracement at 158.29. On the flip side, If the GBP/JPY clears the 20-day EMA at 161.26, it might open the door for a re-test of the 50-day EMA at 162.14.
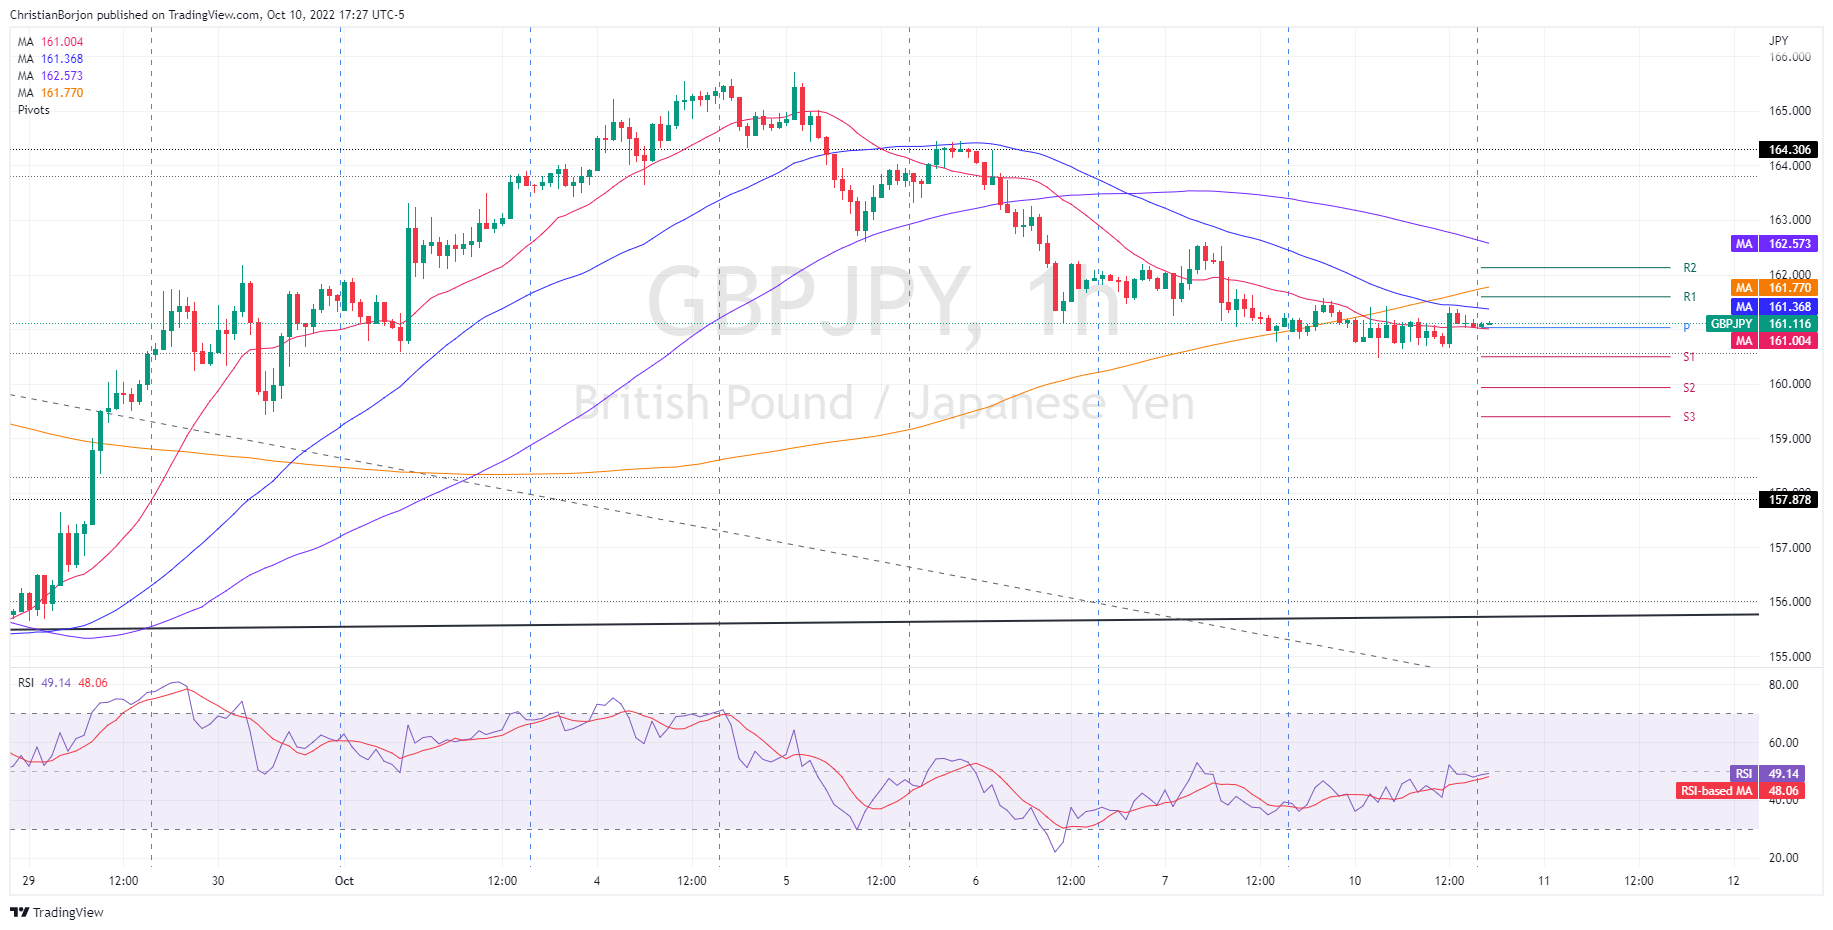
In the one-hour timeframe, the GBP/JPY is neutral-to-downward biased. During the last two trading days, the pair has bottomed around the 160.50-161.50 area, fluctuating above/below the 20-EMA. At the time of typing, the GBP/JPY sits above the 20-EMA, which usually it’s a bullish signal. However, the presence of the 50, 100, and 200-EMAs, above the exchange rate would cap any rallies towards a re-test of October’s 7 high at 162.60.
Therefore, the GBP/JPY first support would be the daily pivot at 161.04. Once cleared, the next support would be the confluence of October 10 and the S1 daily pivot at around 160.46/49, followed by the S2 daily pivot at 159.94. A breach of the latter will expose the confluence of the September 30 low at 159,43 and the S3 pivot point at 159.35-43 area.
GBP/JPY Additional Technical Levels