- AUD/USD Price Analysis: Bulls eye a run to test Septmber lows
Notícias do Mercado
AUD/USD Price Analysis: Bulls eye a run to test Septmber lows
- AUD/USD bulls eye a test of key trendline resistance.
- The bulls need to get above last month's lows.
As per the start of the week's pre-open analysis, AUD/USD Price Analysis: Pre-open points to bullish correction, eyes on the 61.8% golden, and the follow-up later in Tokyo, AUD/USD Price Analysis: Bulls making good headway start of week, the price has gone on to the target and has even reached into test the 0.63 area as follows:
AUD/USD prior analysis, H1 chart
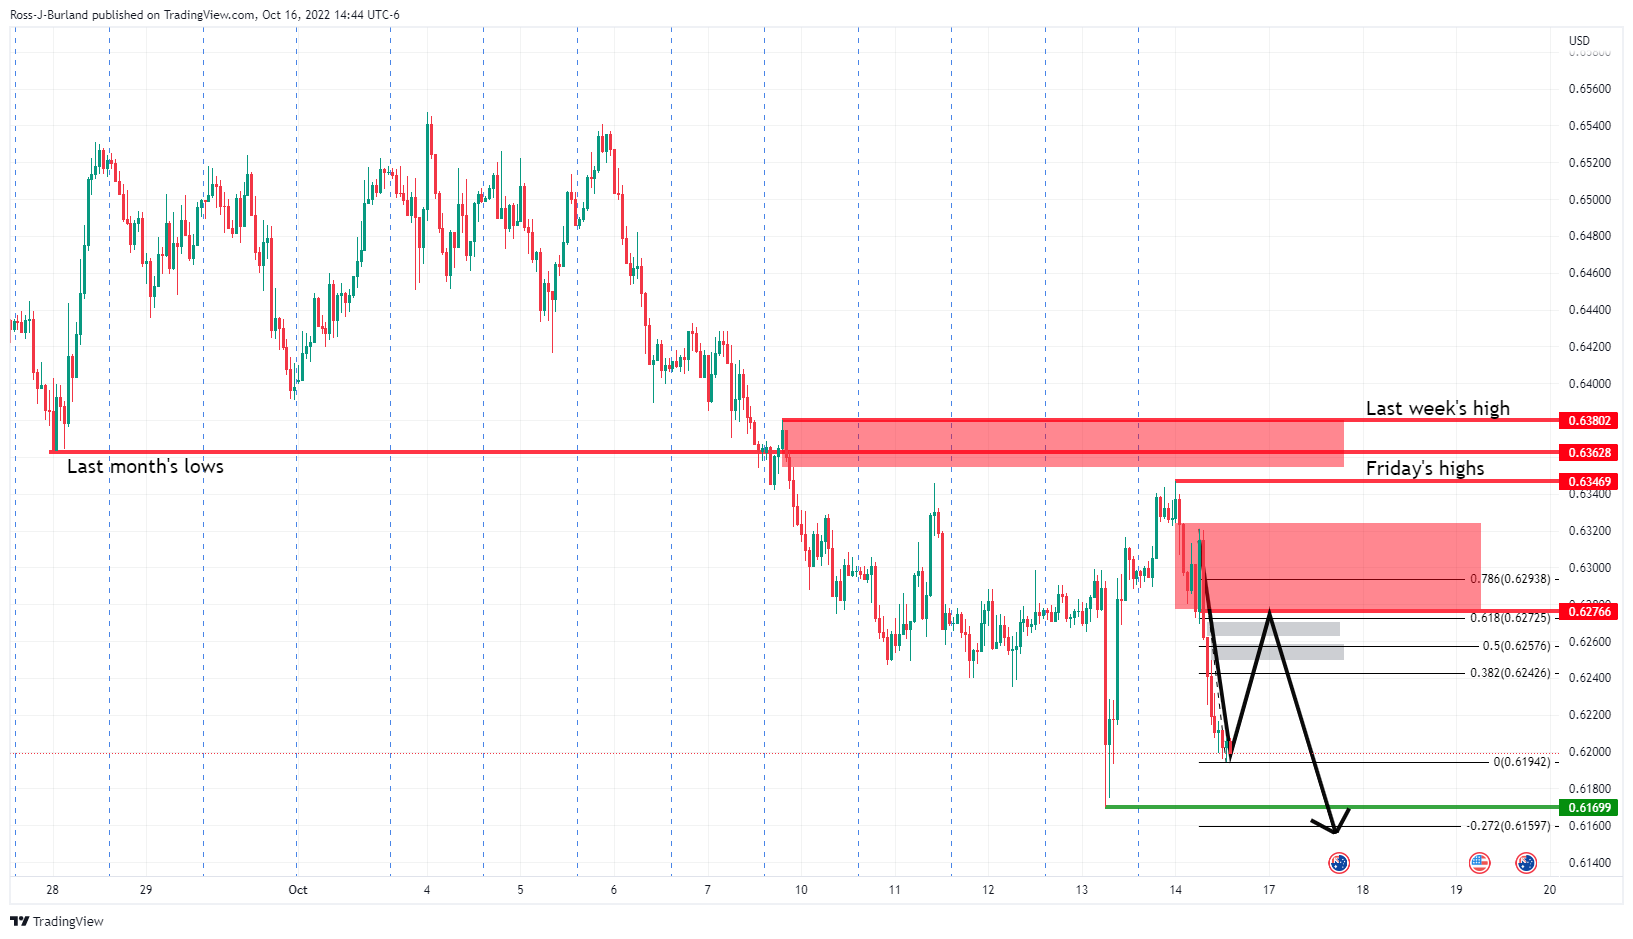
As per the hourly chart, it was explained that AUD/USD was ''well below last month's lows and will remain in the bear's hands so long as Friday's highs of near 0.6250 are not violated.''
A correction into the greyed areas which are price imbalances on the hourly chart was anticipated for the opening sessions on Monday which put the prior bull candle's lows in focus near a 61.8% Fibonacci retracement near 0.6275. It was stated that ''while below this area of resistance, the focus will be on a break of the fresh bear cycle lows near 0.6170 and for a downside continuation.''
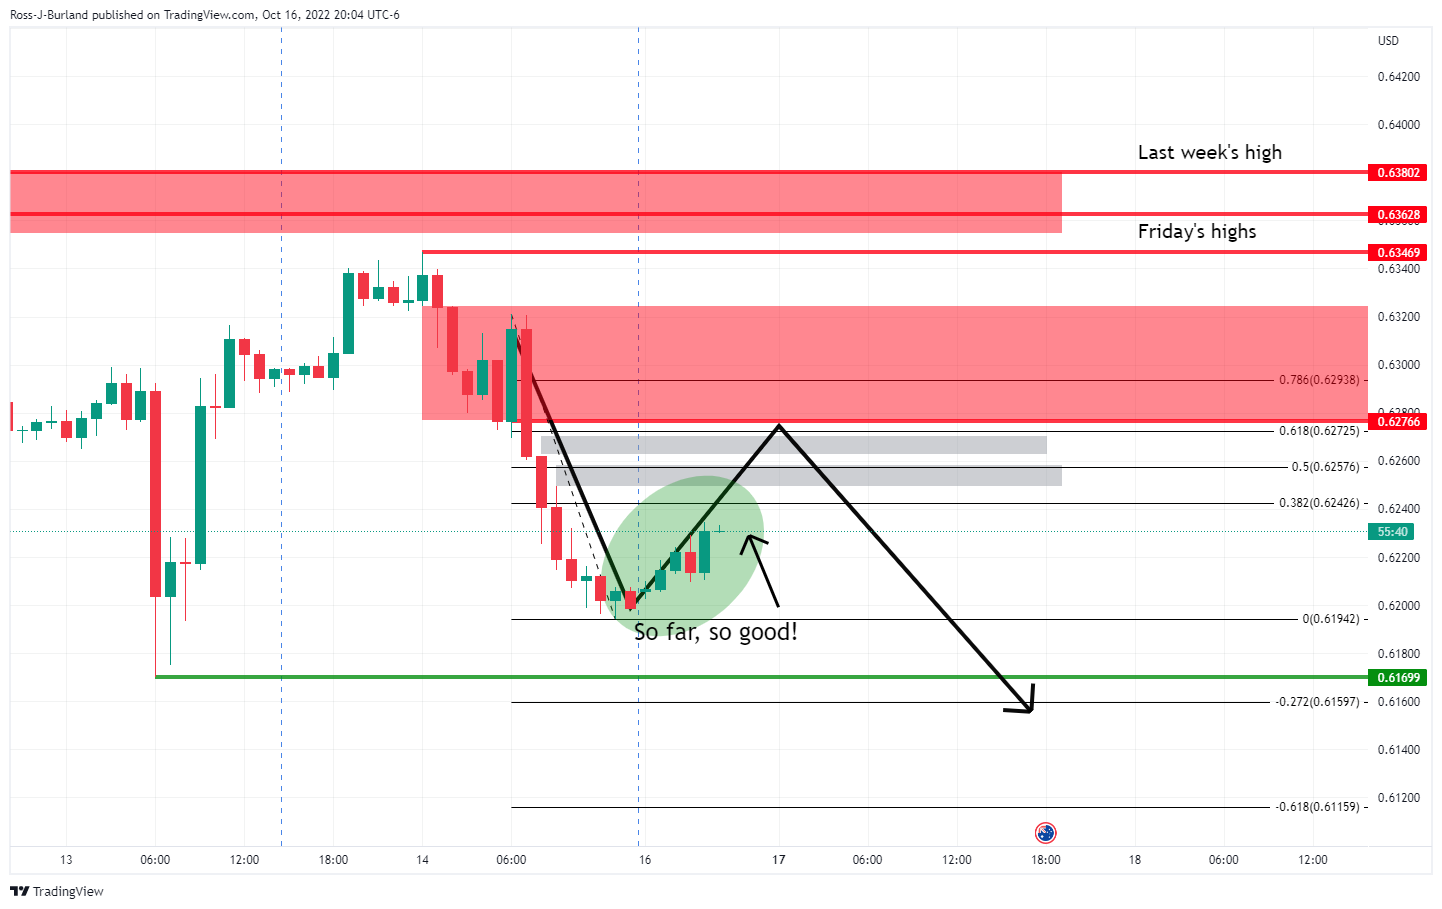
Later that session ...
AUD/USD update
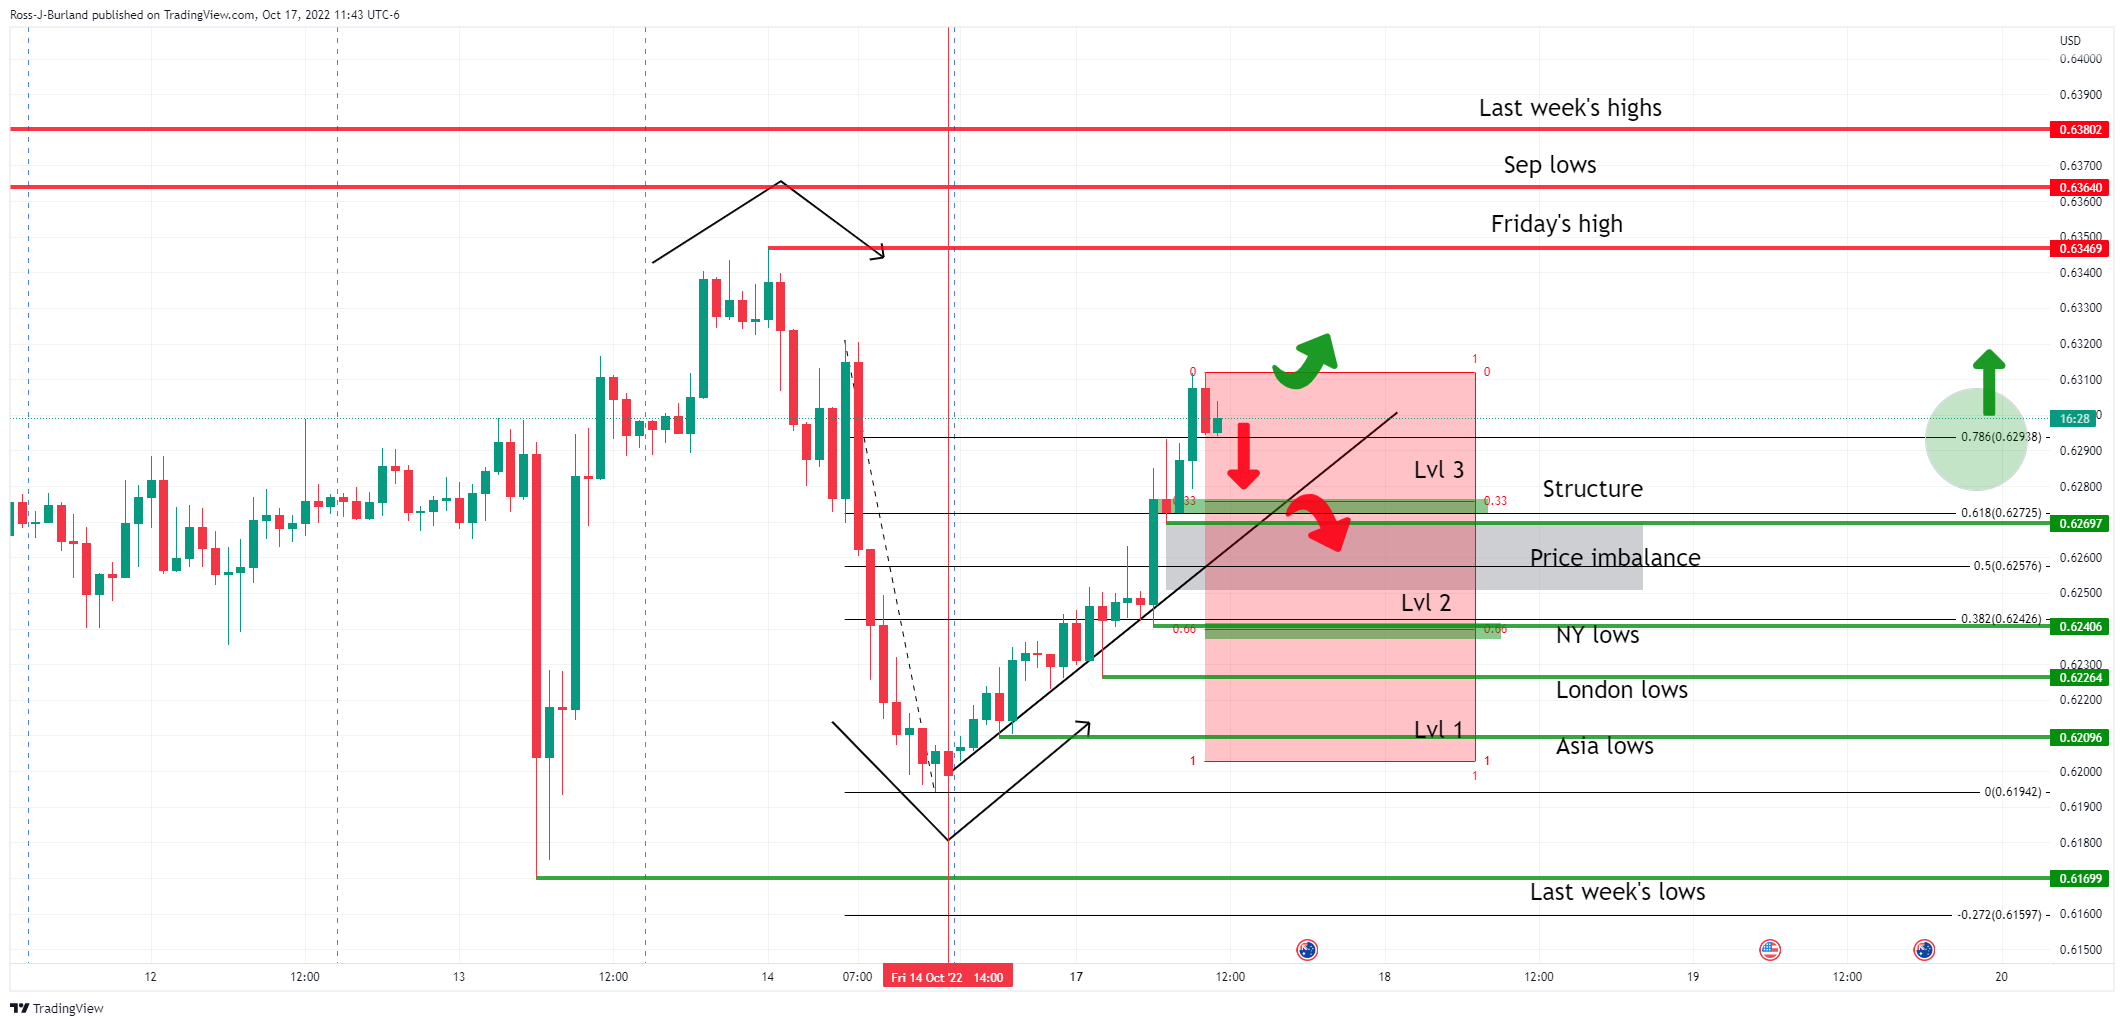
The price has rallied in three sessions, Asia, London and New York, in three levels of rise, respecting the front side of the trendline and breaking a 78.6% Fibonacci retracement level. Following such a move, a correction back into profitable trades in level 2, or even as far down into Asian longs in level 1 should the bulls capitulate in level 2, would be expected. There is also a price imbalance below level 3 that could be mitigated. If the bears commit, then Level 1 longs will be vulnerable considering the break of the bullish structure around 0.6270 on the backside of the trendline. On the other hand, if the bulls stay the course on the front side of the trendline, then Friday's highs near 0.6347 will be eyed that guard September's lows and last week's highs thereafter.
AUD/USD H4 chart
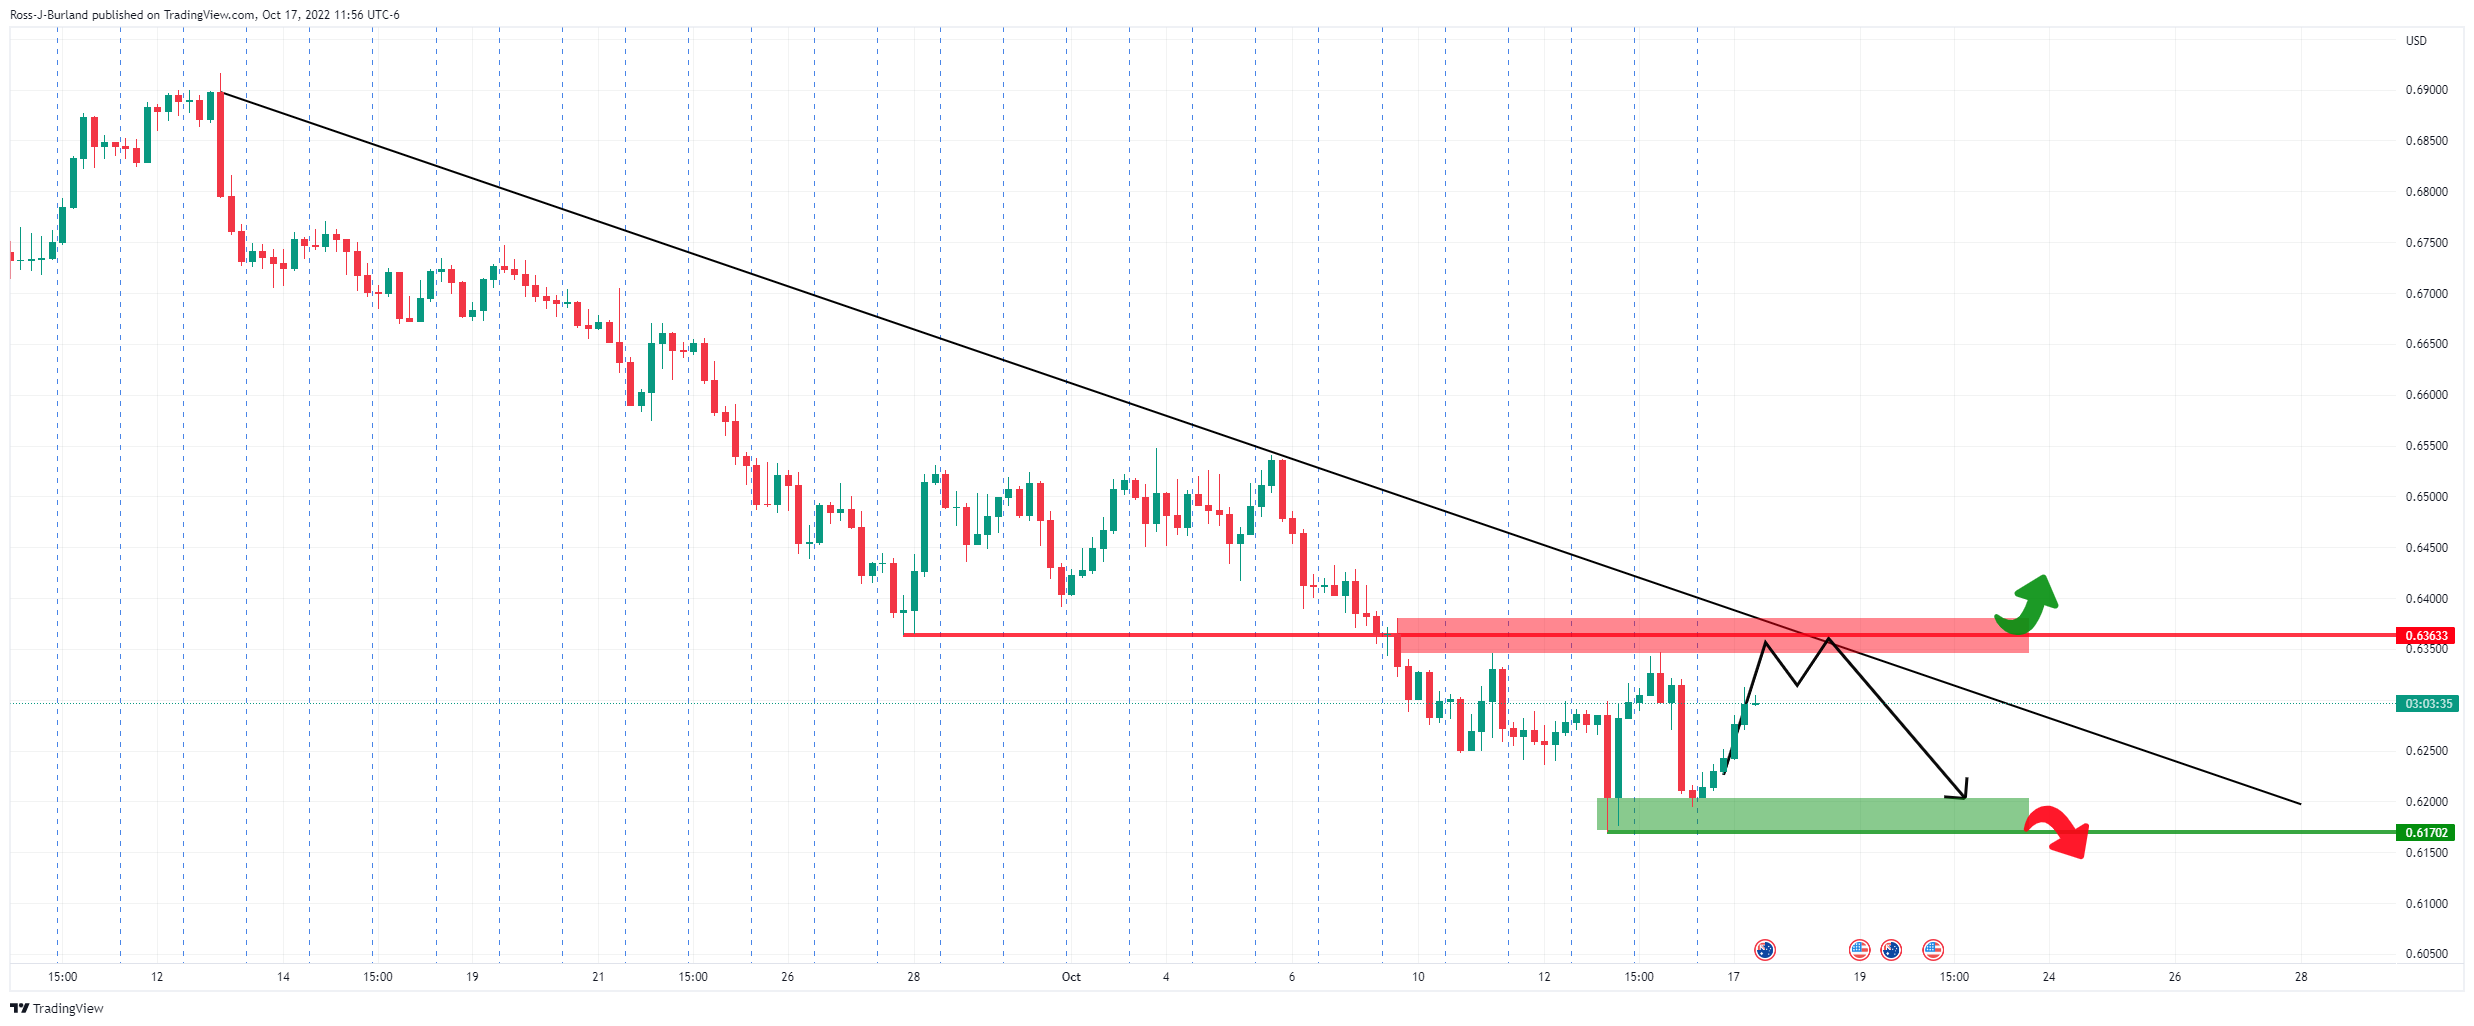
Meanwhile, the price is on the front side of the 4-hour trendline resistance which opens the risk of a break below 0.6170 for the foreseeable future. However, if the bulls manage to get on the backside of the trend, then there will be a bullish case developing above last month's lows.