- GBP/USD Price Analysis: Bulls holding the fort at 1.1550, more to come from the bears or not?
Notícias do Mercado
GBP/USD Price Analysis: Bulls holding the fort at 1.1550, more to come from the bears or not?
- GBP/USD has stalled at a critical support and bulls eye a move to 1.1675.
- Bears are eager for the break of 1.1550 to make way to the PoC at 1.1470.
Cable is yet to clear out the longs below, but perhaps the bulls are not throwing in the towel just yet. The point of control, PoC, in GBP/USD is located down at 1.1470 but the sell-off has yet to break the key support structure at 1.1550. The following illustrates the technical landscape from a daily and hourly perspective.
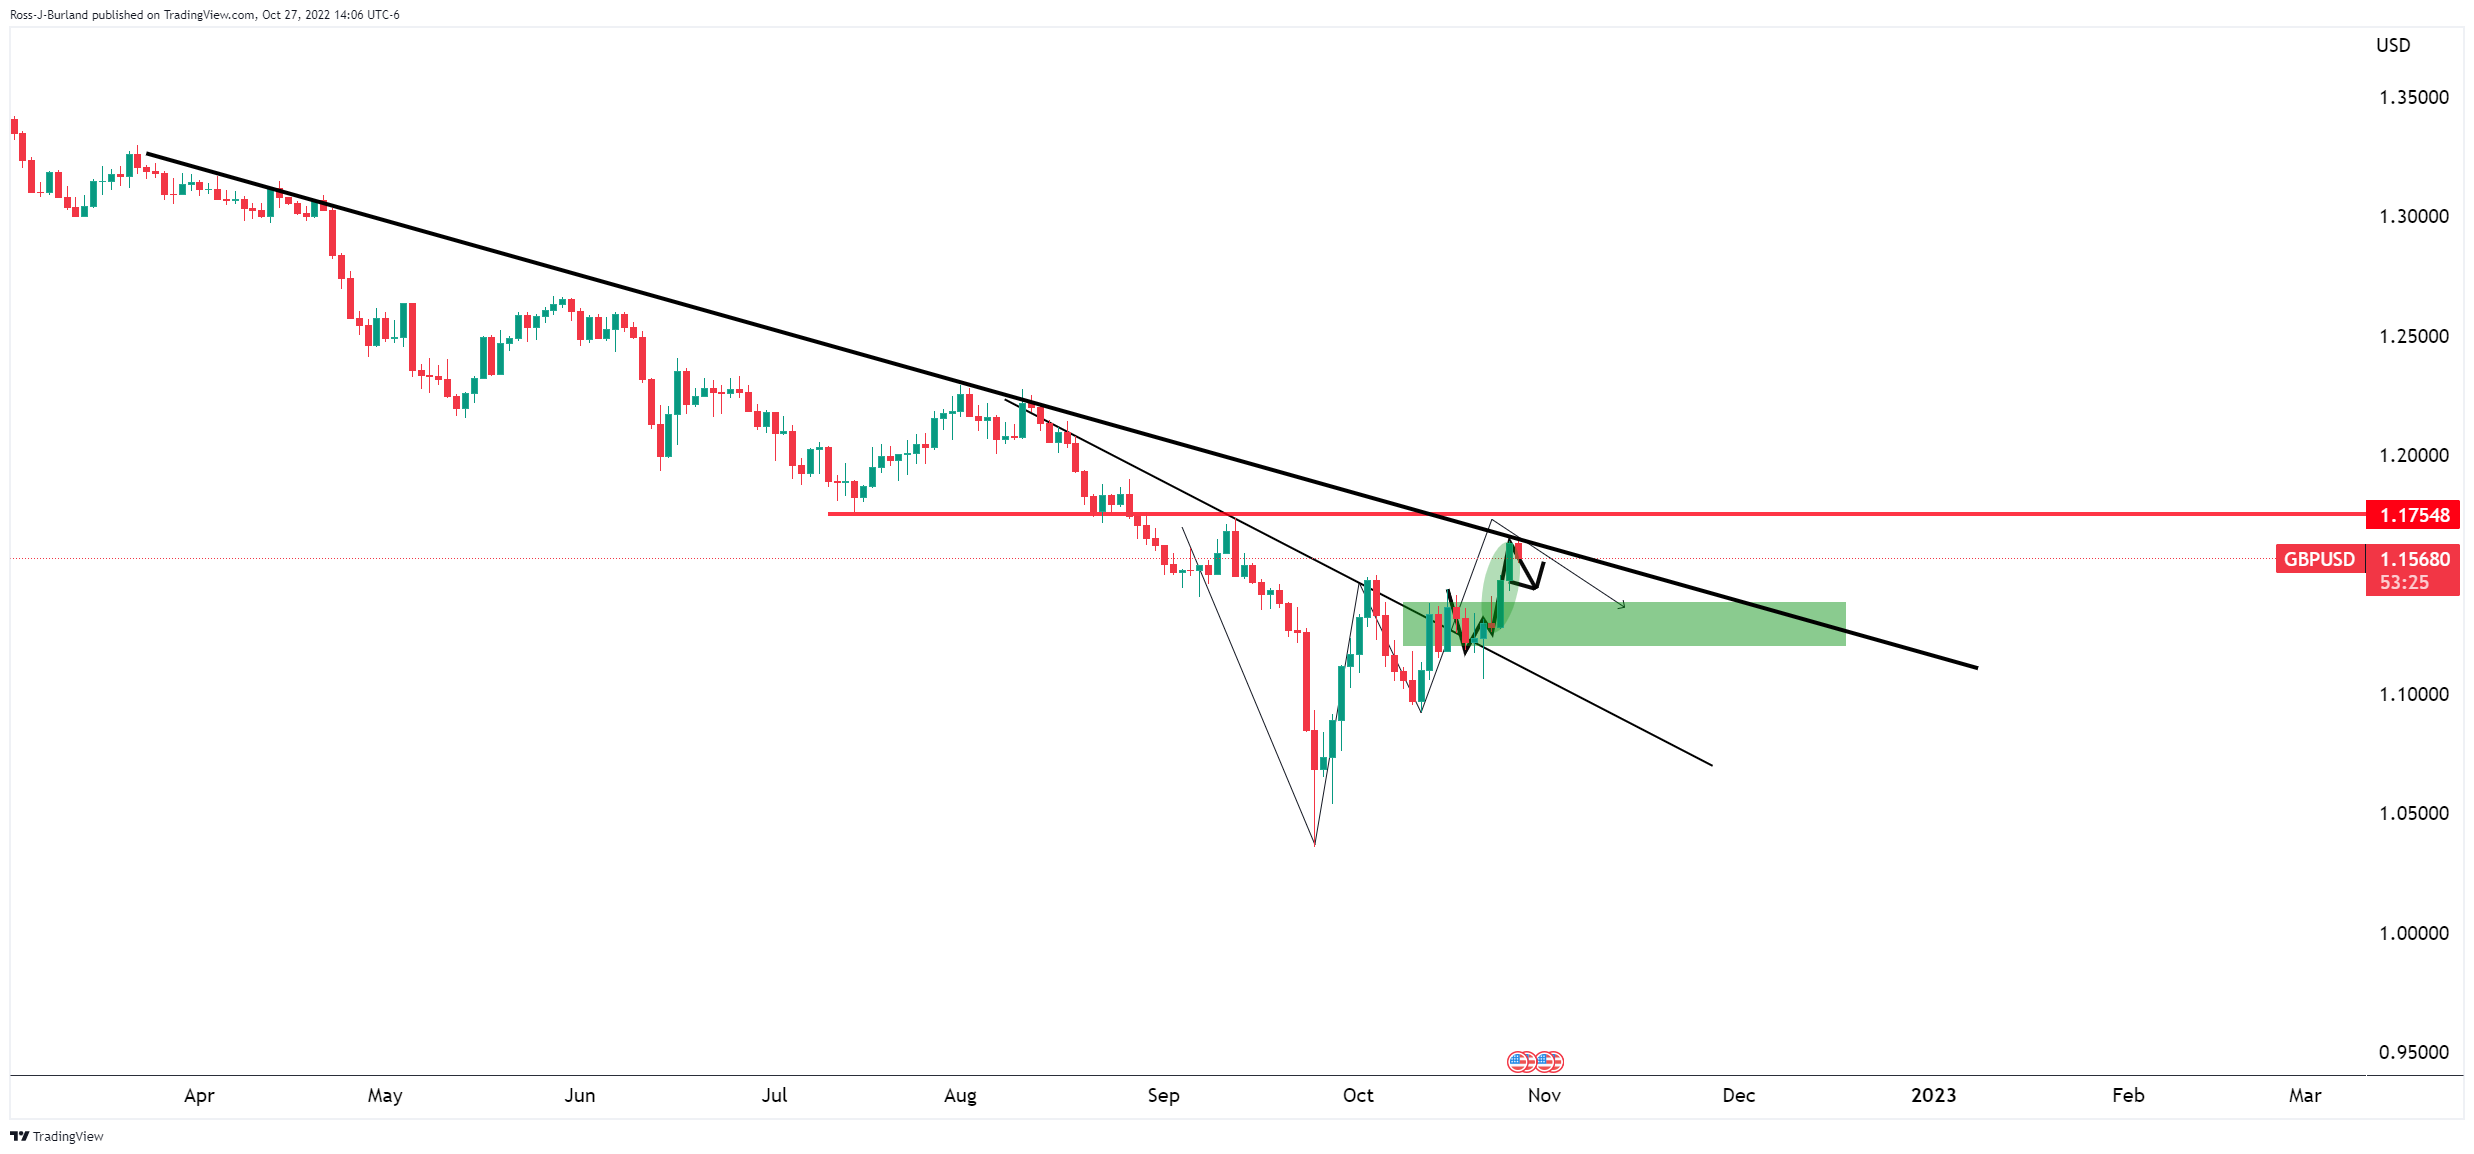
GBP/USD daily charts
The W-formation is troubling for the bulls as a move into the neckline of the reversion pattern as illustrated above. Such a move would put heat onto in-the-money long positions built up over the week in three days of higher highs. We have seen a partial squeeze into those longs but the price has stalled in the US session in what was a volatile start to the day, hitting shorts in the New York open.
The Fibonacci tool has been drawn the current high:
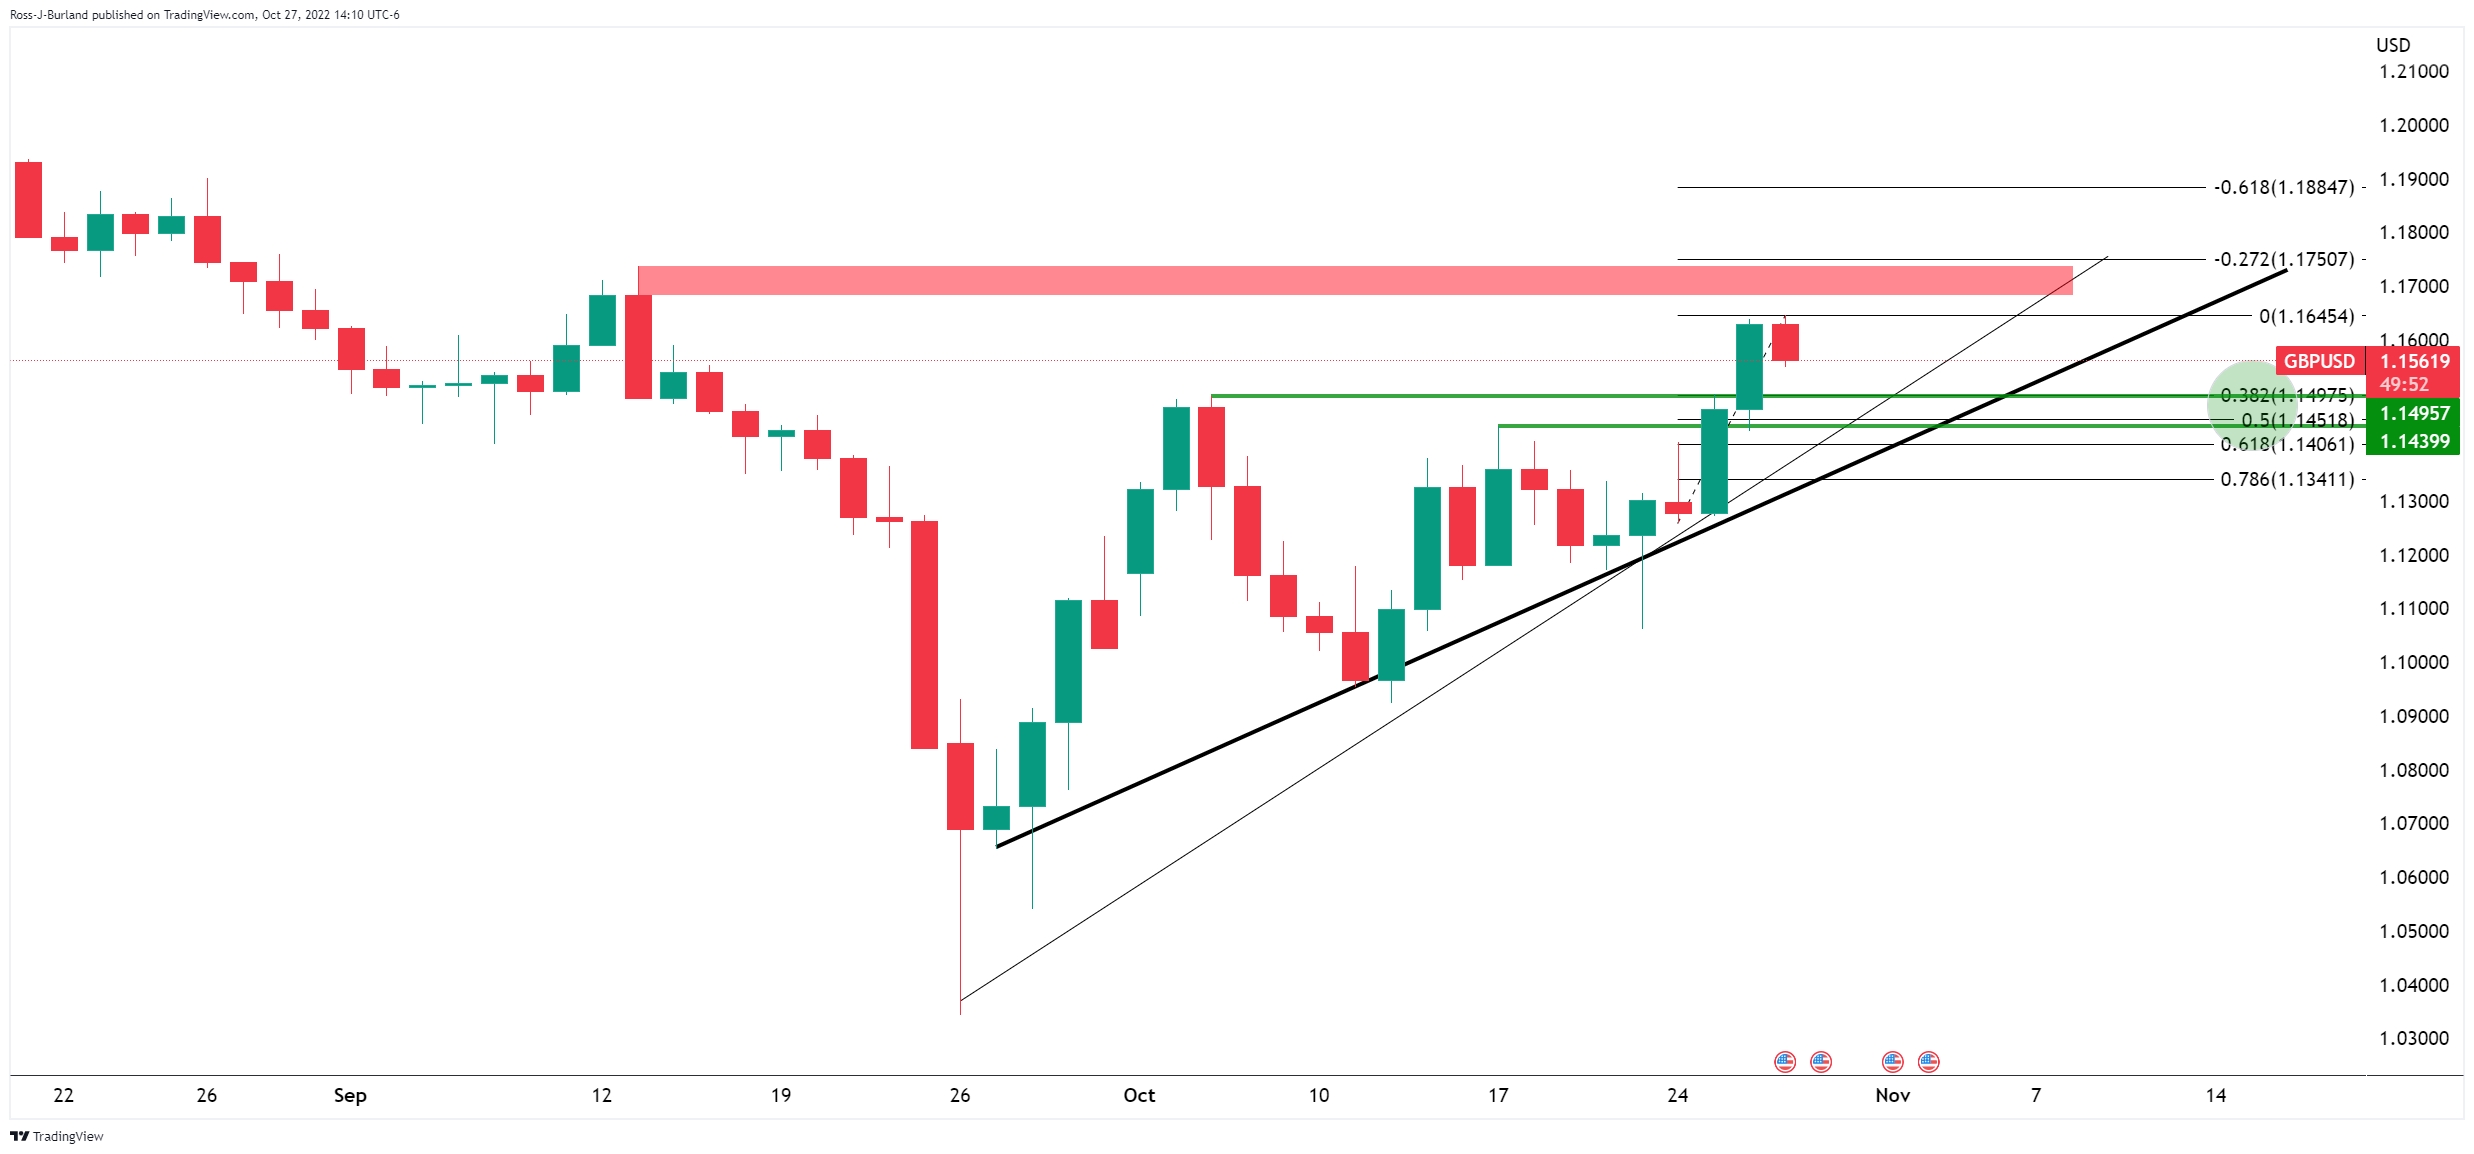
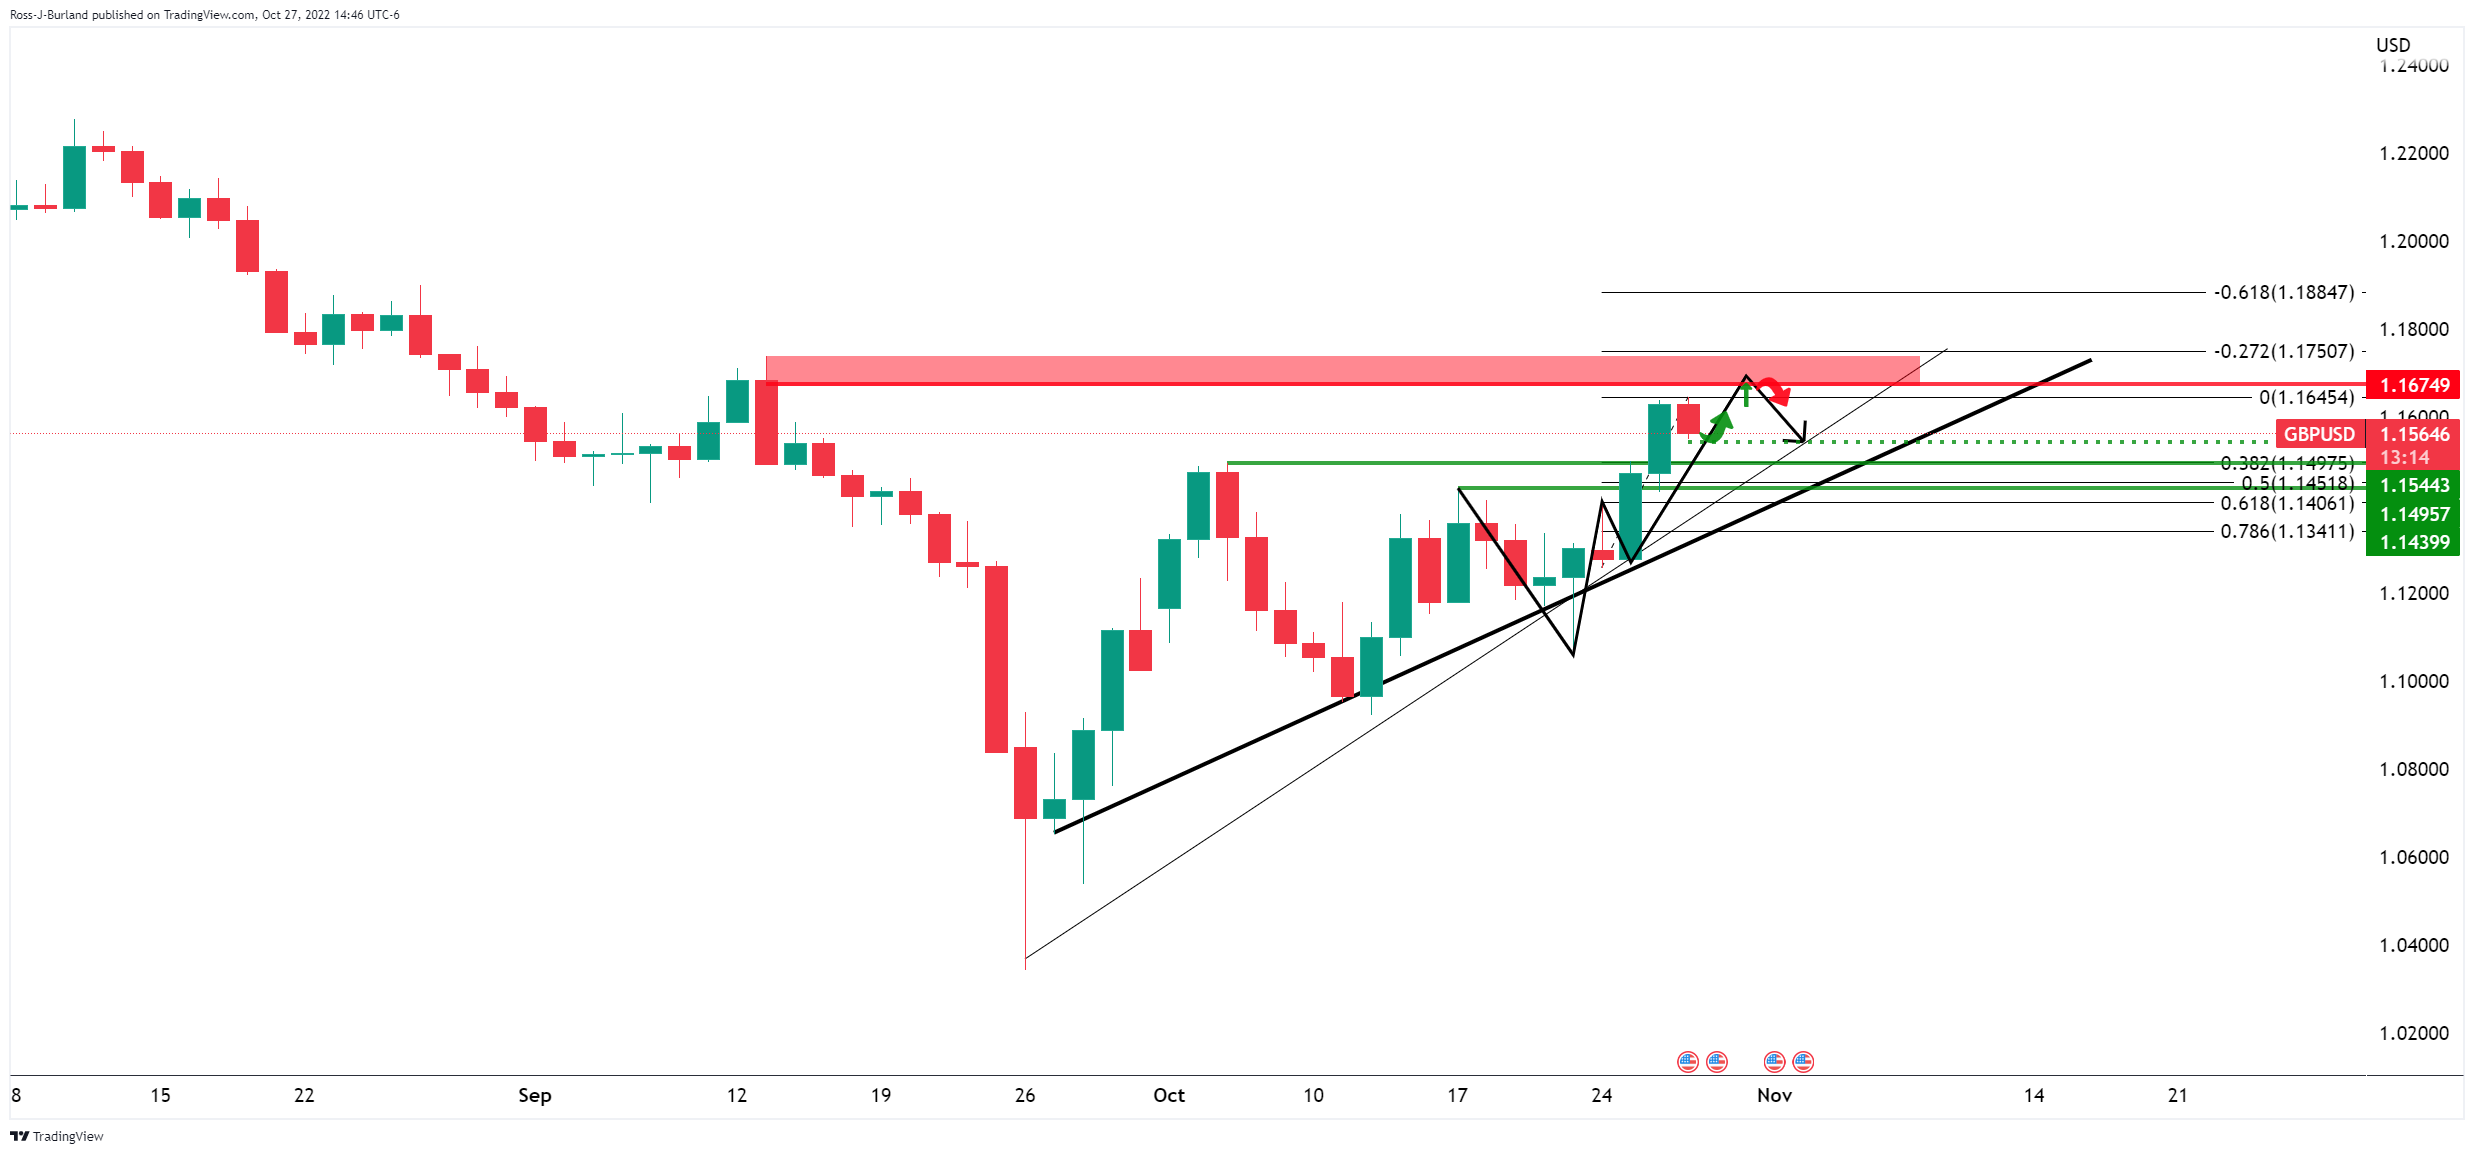
A move into the neckline of the W-formation has a confluence with the 50% mean reversion at 1.1452 before the 61.8% Fibo at 1.1406 on a break below 1.1450. A break of the trendline support opens risk of a break of 1.1270 and then a really significant 1.1060 area. On the upside, with risks of support holding, 1.1675 is the top of a volume cluster.
GBP/USD H1 chart
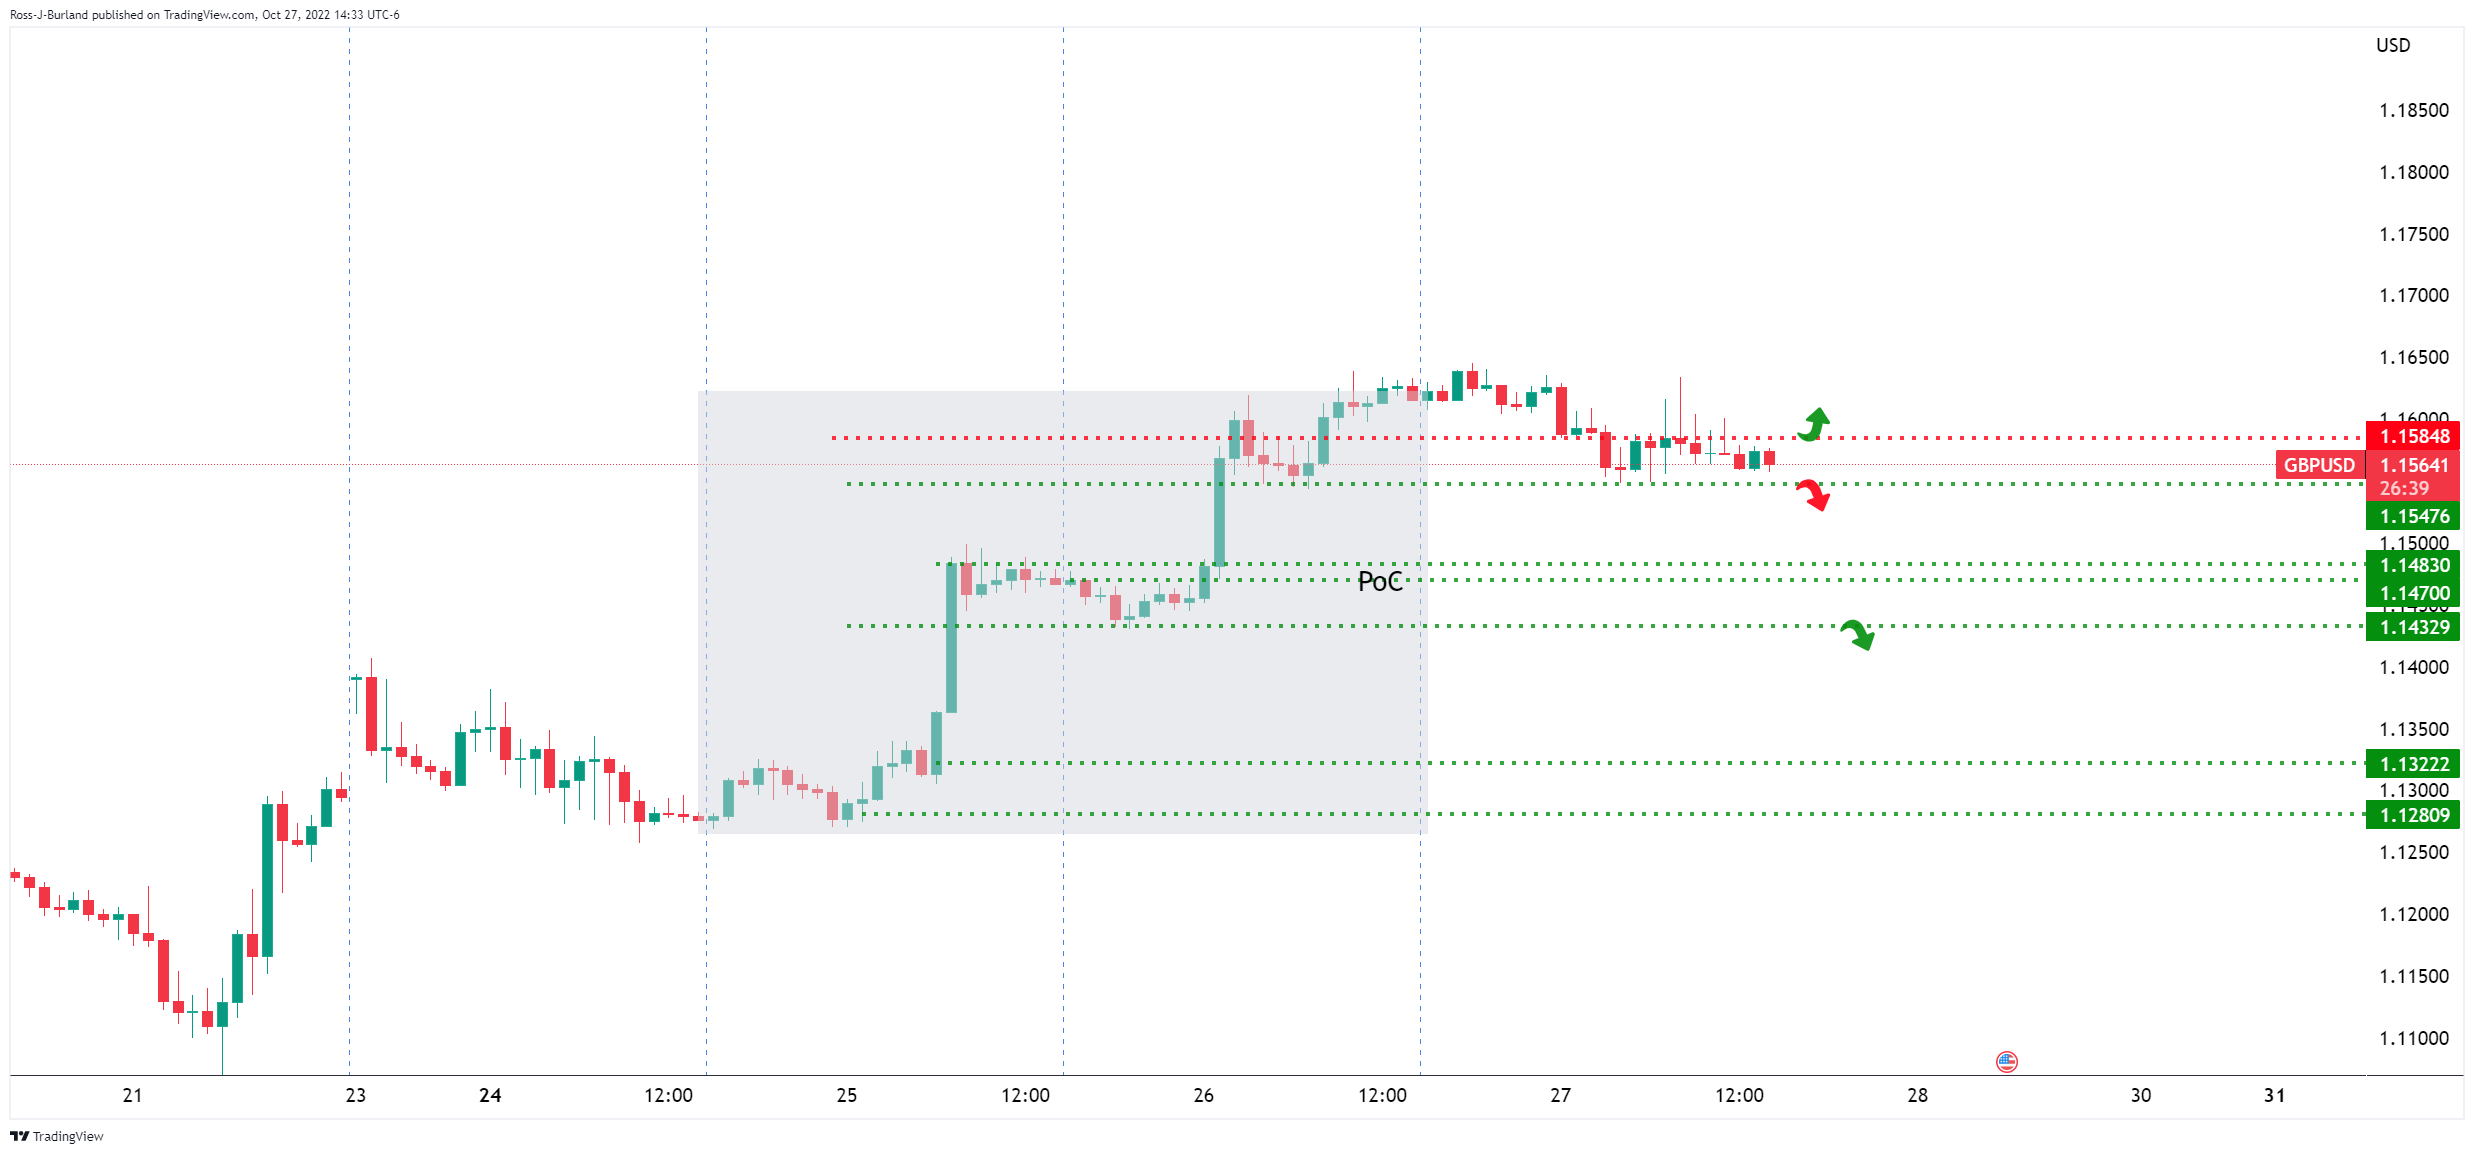
While above 1.1547, as per the hourly time frame, a break of 1.1584 opens such risk of a move to 1.1675 in the near term