- GBP/USD Price Analysis: Cable finds support at 20-EMA around 1.1600
Notícias do Mercado
GBP/USD Price Analysis: Cable finds support at 20-EMA around 1.1600
- Cable bulls are eyeing more upside after a time correction to near the 20-EMA around 1.1600.
- The market mood seems still upbeat despite a rise in returns from US government bonds.
- The RSI (14) has shifted into the bullish range of 60.00-80.00, which indicates more upside ahead.
The GBP/USD pair has overstepped the immediate resistance of 1.1600 in the Asian session amid a subdued performance by the US dollar index (DXY). The DXY is performing lackluster in a limited range ahead of the monetary policy decision by the Federal Reserve (Fed).
Meanwhile, the risk-on impulse still seems solid despite an expansion in 10-year US Treasury yields to 4.05%. S&P500 futures have extended their losses to 0.3% after registering 4% weekly gains.
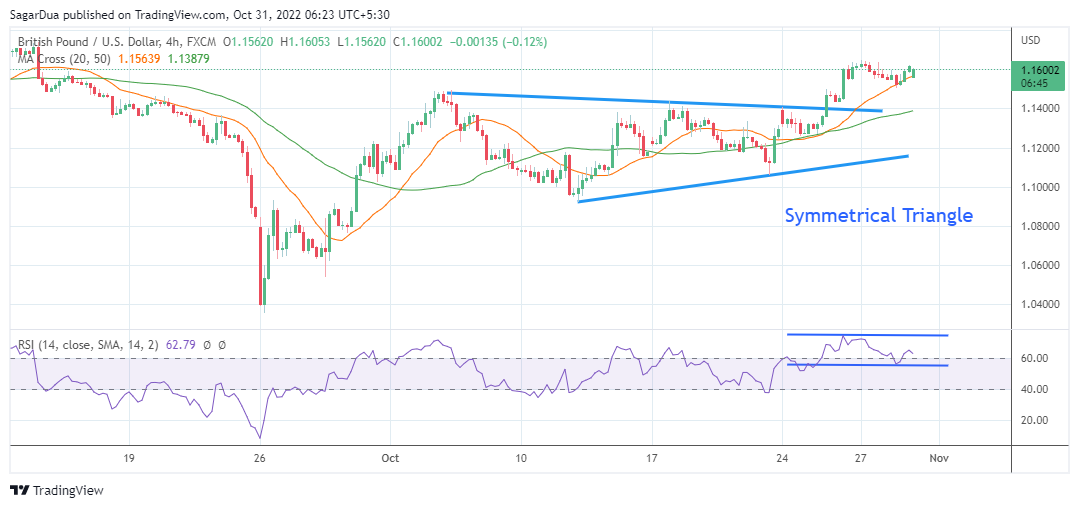
On a four-hour scale, pound bulls have displayed a perpendicular rally after a breakout of the symmetrical triangle chart pattern. The upward-sloping trendline of the chart pattern was placed from October 12 low at 1.0924 while the downward-sloping trendline was plotted from October 5 high at 1.1496.
The asset has rested after a sharp upside move to near the 20-period Exponential Moving Average (EMA) at 1.1580, which is providing a bargain opportunity to the market participants for the execution of longs. Also, the 50-period Exponential Moving Average (EMA) at 1.1400 is advancing, which adds to the upside filters.
Meanwhile, the Relative Strength Index (RSI) (14) is oscillating in a bullish range of 60.00-80.00, which indicates more upside ahead.
Going forward, a decisive break above Thursday’s high at 1.1640 will send the cable towards September 13 high at 1.1732, followed by the round-level resistance at 1.1900.
On the flip side, a downside below the round-level support of 1.1400 will drag the asset toward Tuesday’s low at 1.1269. A slippage below the latter will drag the cable towards a two-week low at 1.1060.
GBP/USD four-hour chart
