- Silver Price Analysis: XAG/USD falls but is subdued around $19.10, ahead of FOMC’s decision
Notícias do Mercado
Silver Price Analysis: XAG/USD falls but is subdued around $19.10, ahead of FOMC’s decision
- Silver price tumbles ahead of the Fed November meeting on a buoyant US Dollar.
- From a daily chart perspective, XAG/USD remains neutral-to-downward biased.
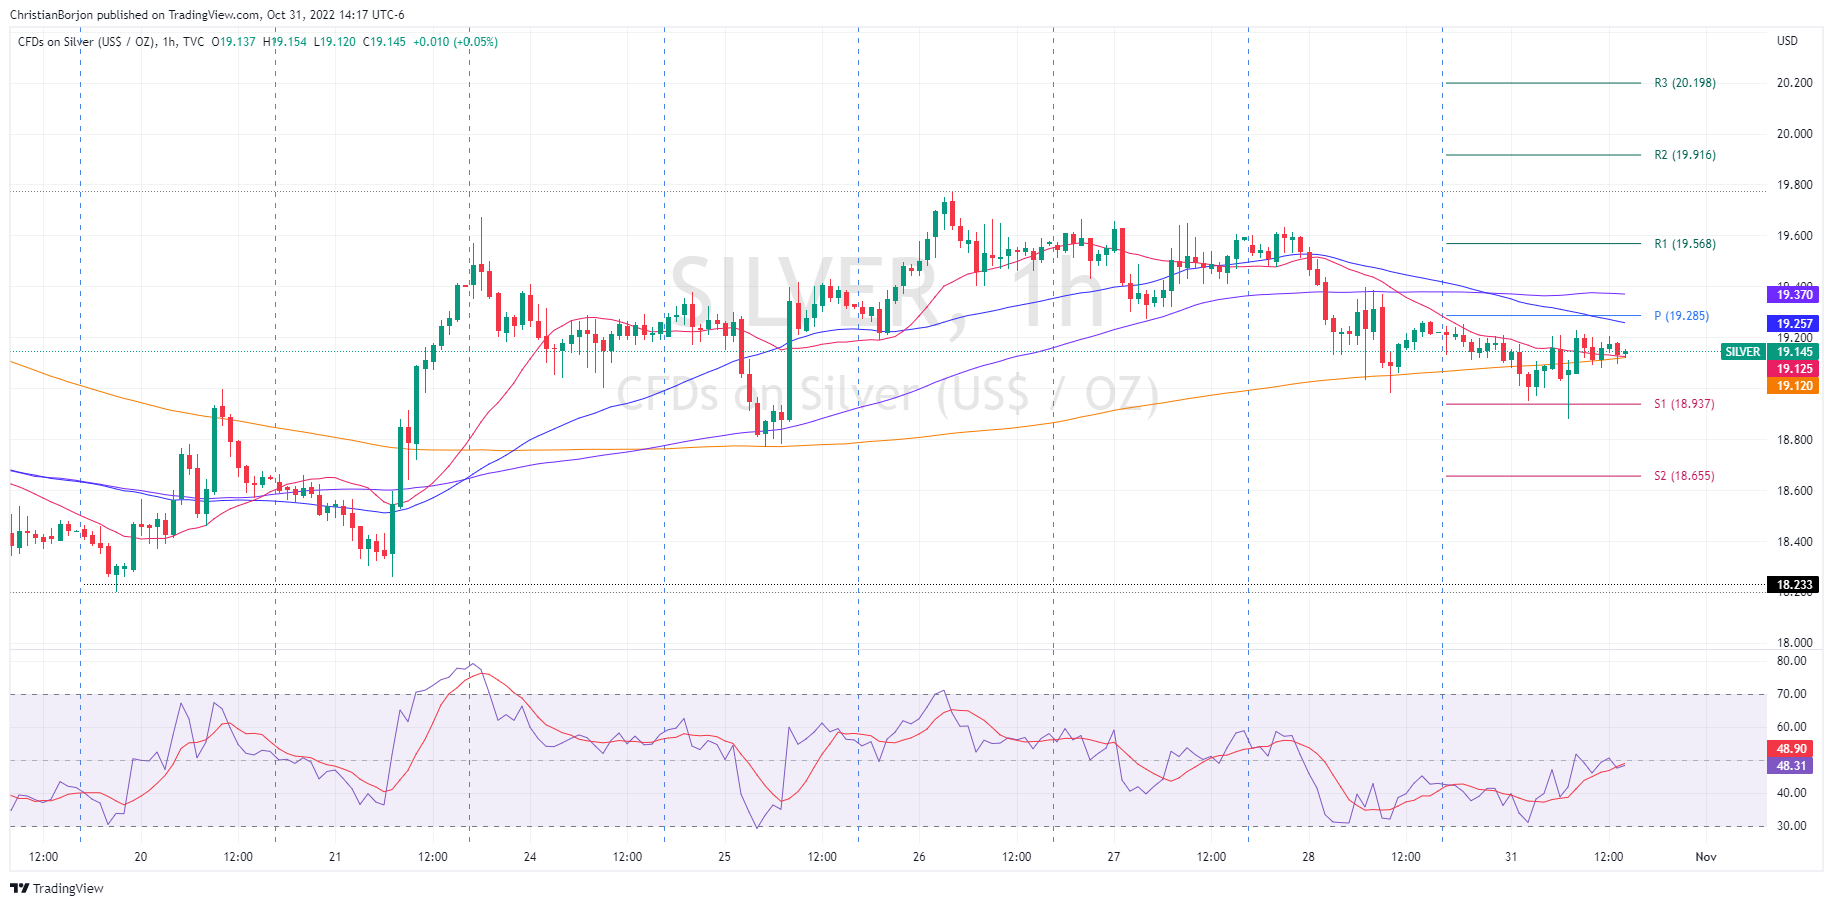
- Short term, the XAG/USD is subdued around $19.10s.
XAG/USD slides from around the daily high at $19.25 towards the 50-day Exponential Moving Average (EMA) at $19.09 amidst broad US Dollar strength, exacerbated by US Treasury yields rising on an almost certain 75 bps Federal Reserve hike at November’s meeting. At the time of writing, XAG/USD is trading at $19.13, below its opening price by 0.40%.
XAG/USD Price Forecast: Technical outlook
From a daily chart perspective, XAG/USD remains neutral-to-downward biased, though it was neutral when the white metal reached a monthly high at $21.23. However, erased its gains, and at the time of typing, it meanders around $19.10s. Worth noting that on its way south, the white metal tumbled below the 100 and the 20-day EMAs, so as mentioned above, the bias remains unchanged.
The Relative Strength Index (RSI) crossed below the 50-midline, meaning sellers are gathering momentum. Nevertheless, XAG/USD needs to achieve a daily close below $19.00, to open the door for further losses.
Short term, the XAG/USD is range-bound. However, traders should be aware that the Exponential Moving Averages (EMAs) remain below the spot price except for the 50 and 100-EMA, hovering around the daily pivot point at $19.25 and $19.37, respectively. Also, the Relative Strength Index (RSI) below the 50-midline is trendless, meaning that silver is consolidated.
Key resistance levels lie at the 50-EMA at $19.25, followed by the daily pivot level at $19.28, ahead of the 100-EMA at $19.37. On the flip side, the XAG/USD first support would be the confluence of the 20 and 200-EMA at $19.12, followed by the S1 daily pivot at $18.93, followed by the S2 pivot level at $18.65.
Key Technical Levels