- USD/CAD Price Analysis: Bears eye 1.3500 amid rising wedge confirmation
Notícias do Mercado
USD/CAD Price Analysis: Bears eye 1.3500 amid rising wedge confirmation
- USD/CAD takes offers to renew intraday low during the first loss-making day in four.
- Confirmation of bearish chart pattern, U-turn from 200-HMA hurdle favor sellers.
- Bulls have a bumpy road unless crossing 1.3700 hurdle.
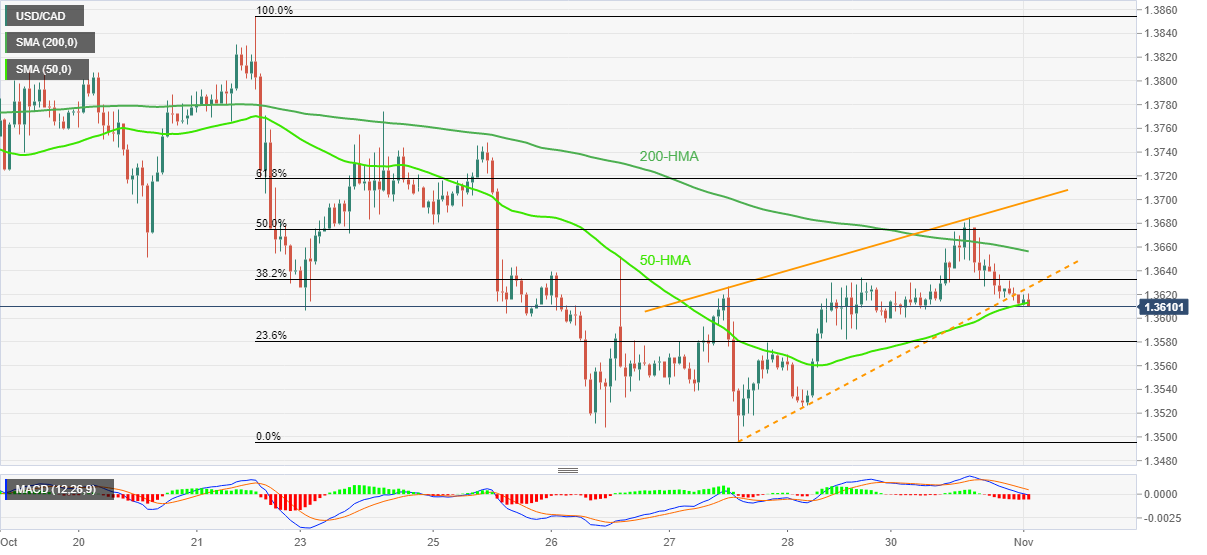
USD/CAD prints the first intraday loss in three as sellers attack 1.3600 early Tuesday.
In doing so, the Loonie pair justifies the previous day’s confirmation of a short-term rising bearish chart pattern, as well as the failure to cross the 200-HMA. Also adding strength to the quote’s downside bias are the bearish MACD signals.
However, the 50-HMA tests the USD/CAD bears around the 1.3600 threshold of late, a break of which could direct the quote towards the theoretical target surrounding 1.3430.
Though, multiple levels surrounding the 1.3500 round figure could challenge the pair’s downside before the 1.3430 level.
It should be noted that the recovery moves need a sustained break of the three-day-old rising wedge’s support line, now resistance around 1.3630, to lure short-term USD/CAD buyers.
Following that, the 200-HMA could test the pair’s further upside near 1.3660.
If the USD/CAD prices remain firmer past the 200-HMA, the aforementioned wedge’s upper line near 1.3700 will be crucial for the bulls to keep the reins.
Overall, USD/CAD has confirmed a bearish chart pattern and is likely to decline further, at least for the short term.
USD/CAD: Hourly chart
Trend: Further downside expected